Why do marketing teams keep going back to spreadsheets
Why do marketing teams keep going back to spreadsheets for their reporting needs? Arun Srinivasan, CEO of Clarisights, shares his perspective on this puzzle. Arun also shares pro tips on the ideal reporting data stack at each stage of your company's growth.

One of the things data teams hate most is when business users don’t use the dashboards built for them. Instead, they look for a CSV export. In the meme above you can replace PowerBI with any data visualisation tool you like—Looker, Tableau—and user behaviour is going to be the same.
This may seem surprising. Companies invest vast amounts of money in the Modern Data Stack (MDS). And yet their performance marketing teams ignore all these powerful tools, and persist with spreadsheets to report on growth. Why?
Depending on who you ask, you are going to get different reasons for this pattern. Data teams often put this down to problems with business teams: a lack of data literacy, inadequate training, and inertia. Business teams, on the other hand, complain about slow-loading dashboards, long response cycles from data teams, and requests for updates and changes stuck in JIRA ticket limbo.
Here at Clarisights we are a product company that works with some of the most sophisticated, data-driven business teams at organisations like Uber, Delivery Hero, HelloFresh and WorldRemit. Day in and day out we get to see, and help build, some of the best marketing reporting setups. Over time we’ve derived our own insight into this pattern of behaviour in companies that rely on performance marketing for growth. In this post I’d like to share these learnings, and also share best practices for companies at different stages in their business and reporting journey.
The insights and observations here are specific to marketing setups at B2C companies. But some readers may find vertical- and horizontal-agnostic lessons here.
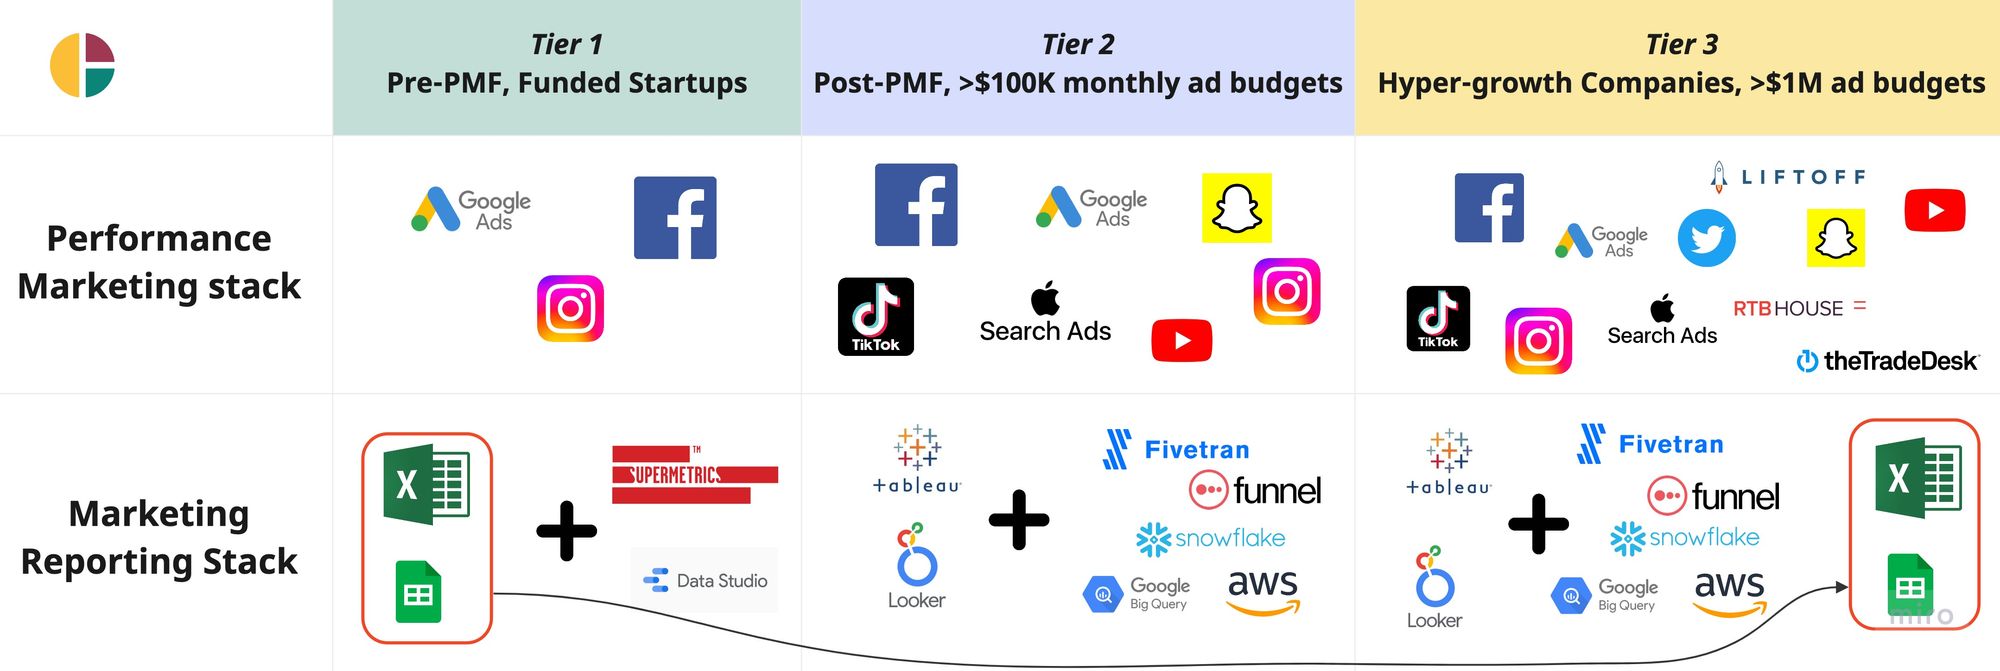
Let’s get started. At Clarisights, we see companies graduate through three Tiers as they grow from bootstrap to billions. At each Tier, companies should make reporting choices that suit their growth stage.
Tier 1: Pre-PMF / Funded Startups from Seed to Series A (The Spreadsheet Sweetspot)
Growth Channels: 1-2 channels, Google and maybe Meta depending on your product offering
Monthly Budgets: < USD 100,000
Reporting Complexity: Low
Typical Data Stack at Tier 1: Google Data Studio, Supermetrics and, of course, Google Sheets. Inexpensive, efficient, and accessible.
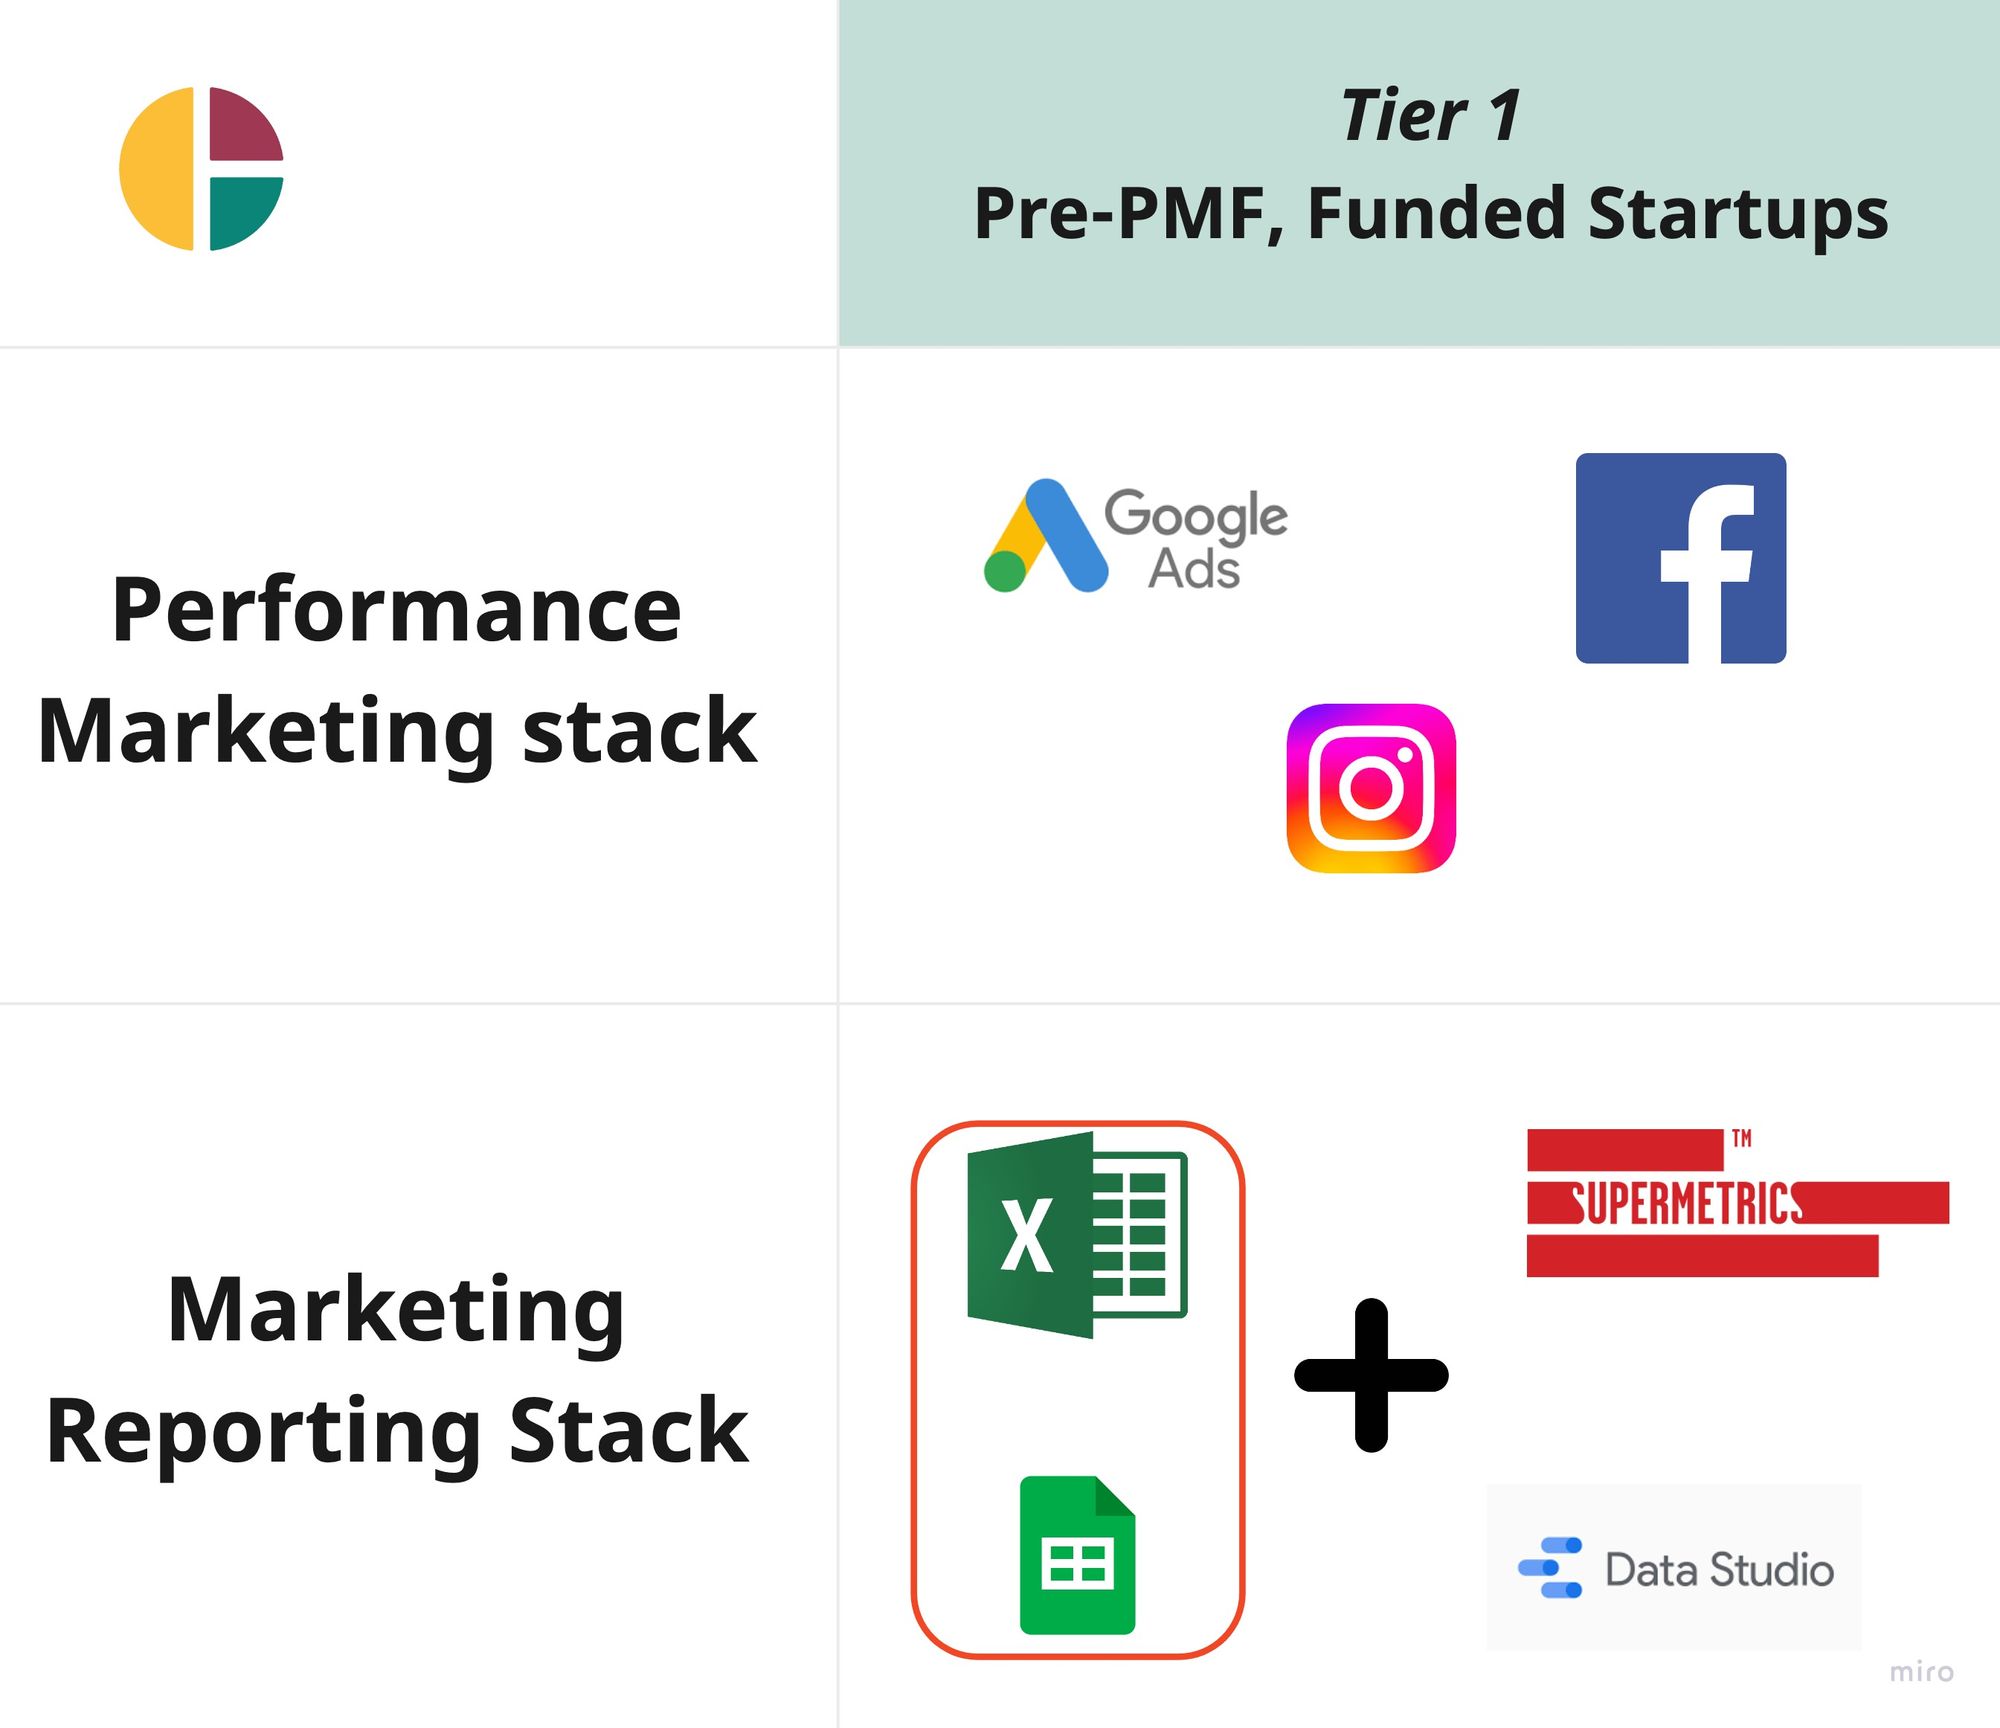
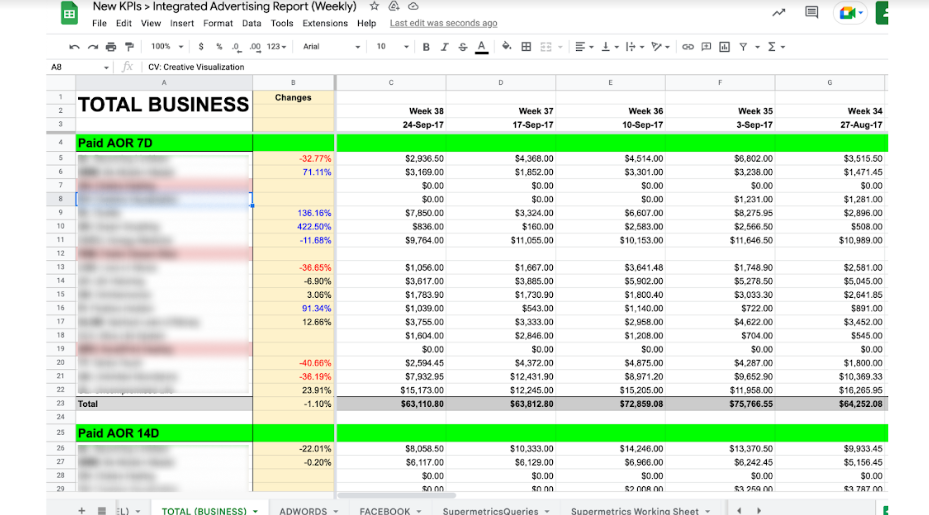
At this stage, the only thing that matters is getting to PMF. Speed of decision-making is more important than 100% accurate data. All you need is a Daily KPI dashboard on Google Sheets, and something like Supermetrics to pull in cost data from your channels, along with revenue and order data from Google Analytics or Shopify. The marketing team is probably not fully staffed. In fact, the function itself is probably somebody’s fractional responsibility. You don’t need a Data Team or a Data Warehouse at this stage.
Getting to PMF requires spending more time on Google Ads, running experiments on Tiktok/Meta, testing creatives, and figuring out if the CAC is directionally feasible.
Investing in a data warehouse at this stage is more trouble than it is worth. Honestly, your startup has bigger fish to fry. You don’t have to take our word for it but hear it straight from someone who has done it countless times before.
What your reports should look like:
Tier 2: Post - PMF (Too Complex For Spreadsheets)
Growth Channels: 2-3 channels, Google, Meta and maybe TikTok, Snap.
Monthly Budgets: USD 100,000 and growing
Reporting Complexity: Medium
Typical Data Stack at Tier 2: Fivetran, Funnel.io and Snowflake. You're probably still using BigQuery and, depending on the skills of your data team, AWS.
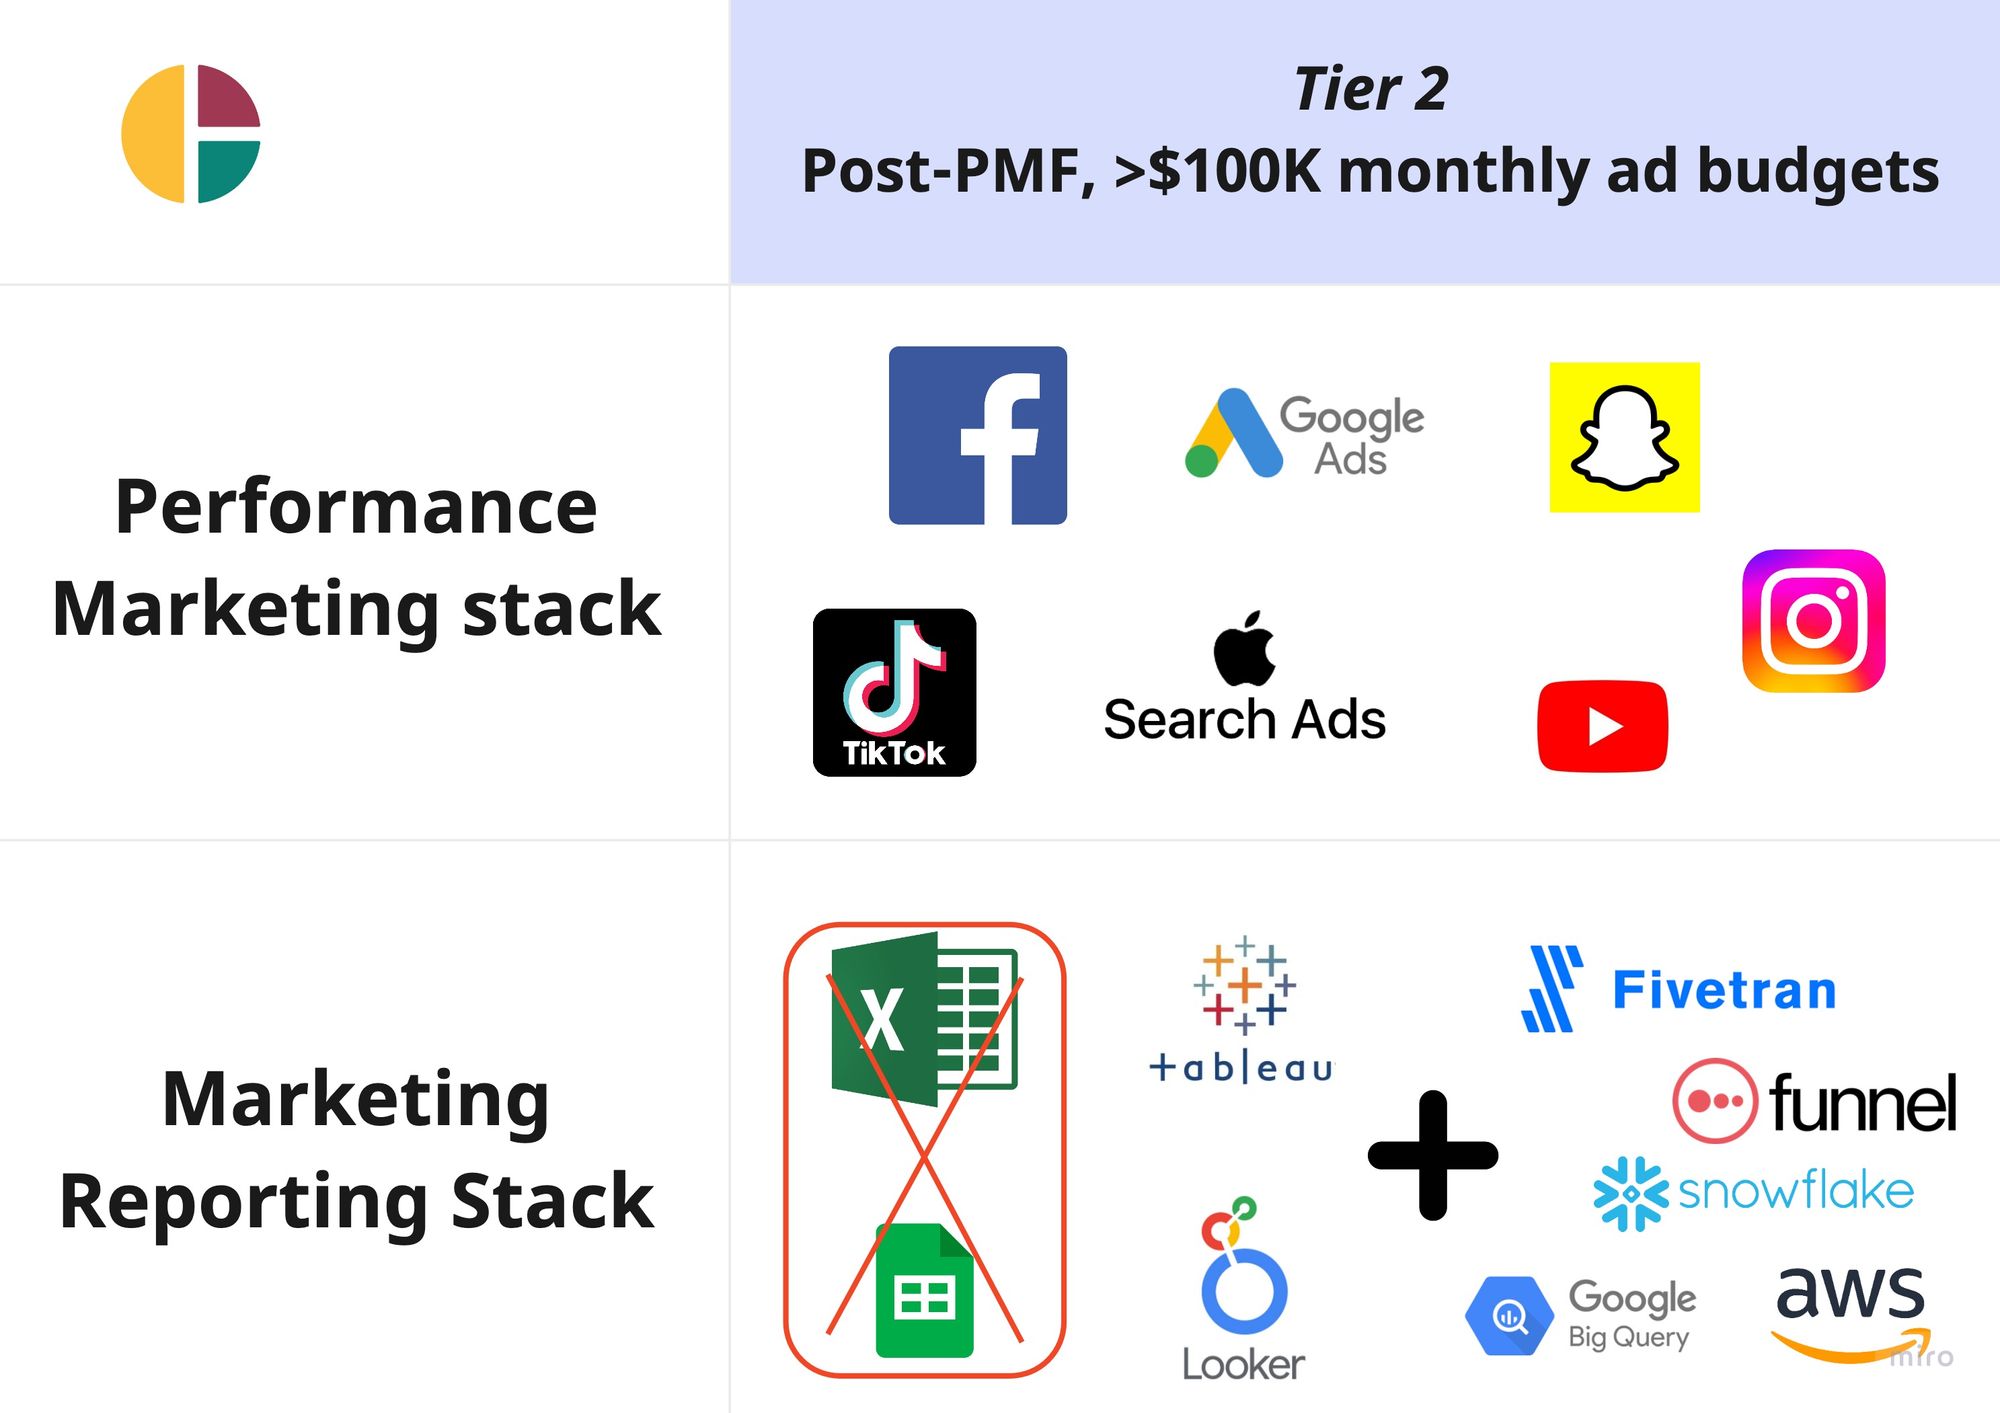
At this stage, you are starting to see growing diversity in the channel mix and the establishment of dedicated teams for different marketing channels.
This complexity will soon multiply once you start investing in attribution, CRM, mobile app marketing and so on. This is usually the point at which spreadsheets start to break, and you no longer have a single source of truth. This is also the point at which different teams start reporting revenue, and conversions differently. In short, things are getting much more complex and much more data-intensive.
At this stage in the company’s lifecycle meetings start with teams arguing over the definition and accuracy of metrics. This is usually the end of the road for something like Supermetrics, and the point at which companies invest in two things: i) a Data Warehouse and ii) a Data Team.
This represents the biggest change that takes place when companies transition from Tier 1 to Tier 2: They go from having no data warehouse and no data team to a more or less centralized data warehouse, and a business-critical data team.
Why these two investments? A centralized data warehouse ensures that every function across the enterprise is looking at the same numbers. And a data team consolidates all the reporting into one dashboard/report platform built on this single source of data.
A combination of a great data team and a strong growth team can drive the two most important pillars of growth for a company at this stage: customer acquisition and retention. You really want those two teams to work closely together.
Once you set up this data and reporting infrastructure, most teams are happy. It’s an incredibly rewarding project for the data team to invest in, and everyone in the company is finally happy to move away from manual reporting numbers, to logging into your BI platform every day to stay on top of things. You can breathe a sigh of relief and go back to meetings without the bickering.

Tier 3: Hyper-growth Companies (Hello Spreadsheets. We Meet Again.)
Growth Channels: 3+ channels, Google, Meta, TikTok, Twitter, and a lot of Affiliates
Monthly Budgets: USD 1,000,000 and growing
Reporting Complexity: High
Typical Data Stack at Tier 3: A combination between Tier 1 and 2 (but with added chaos).
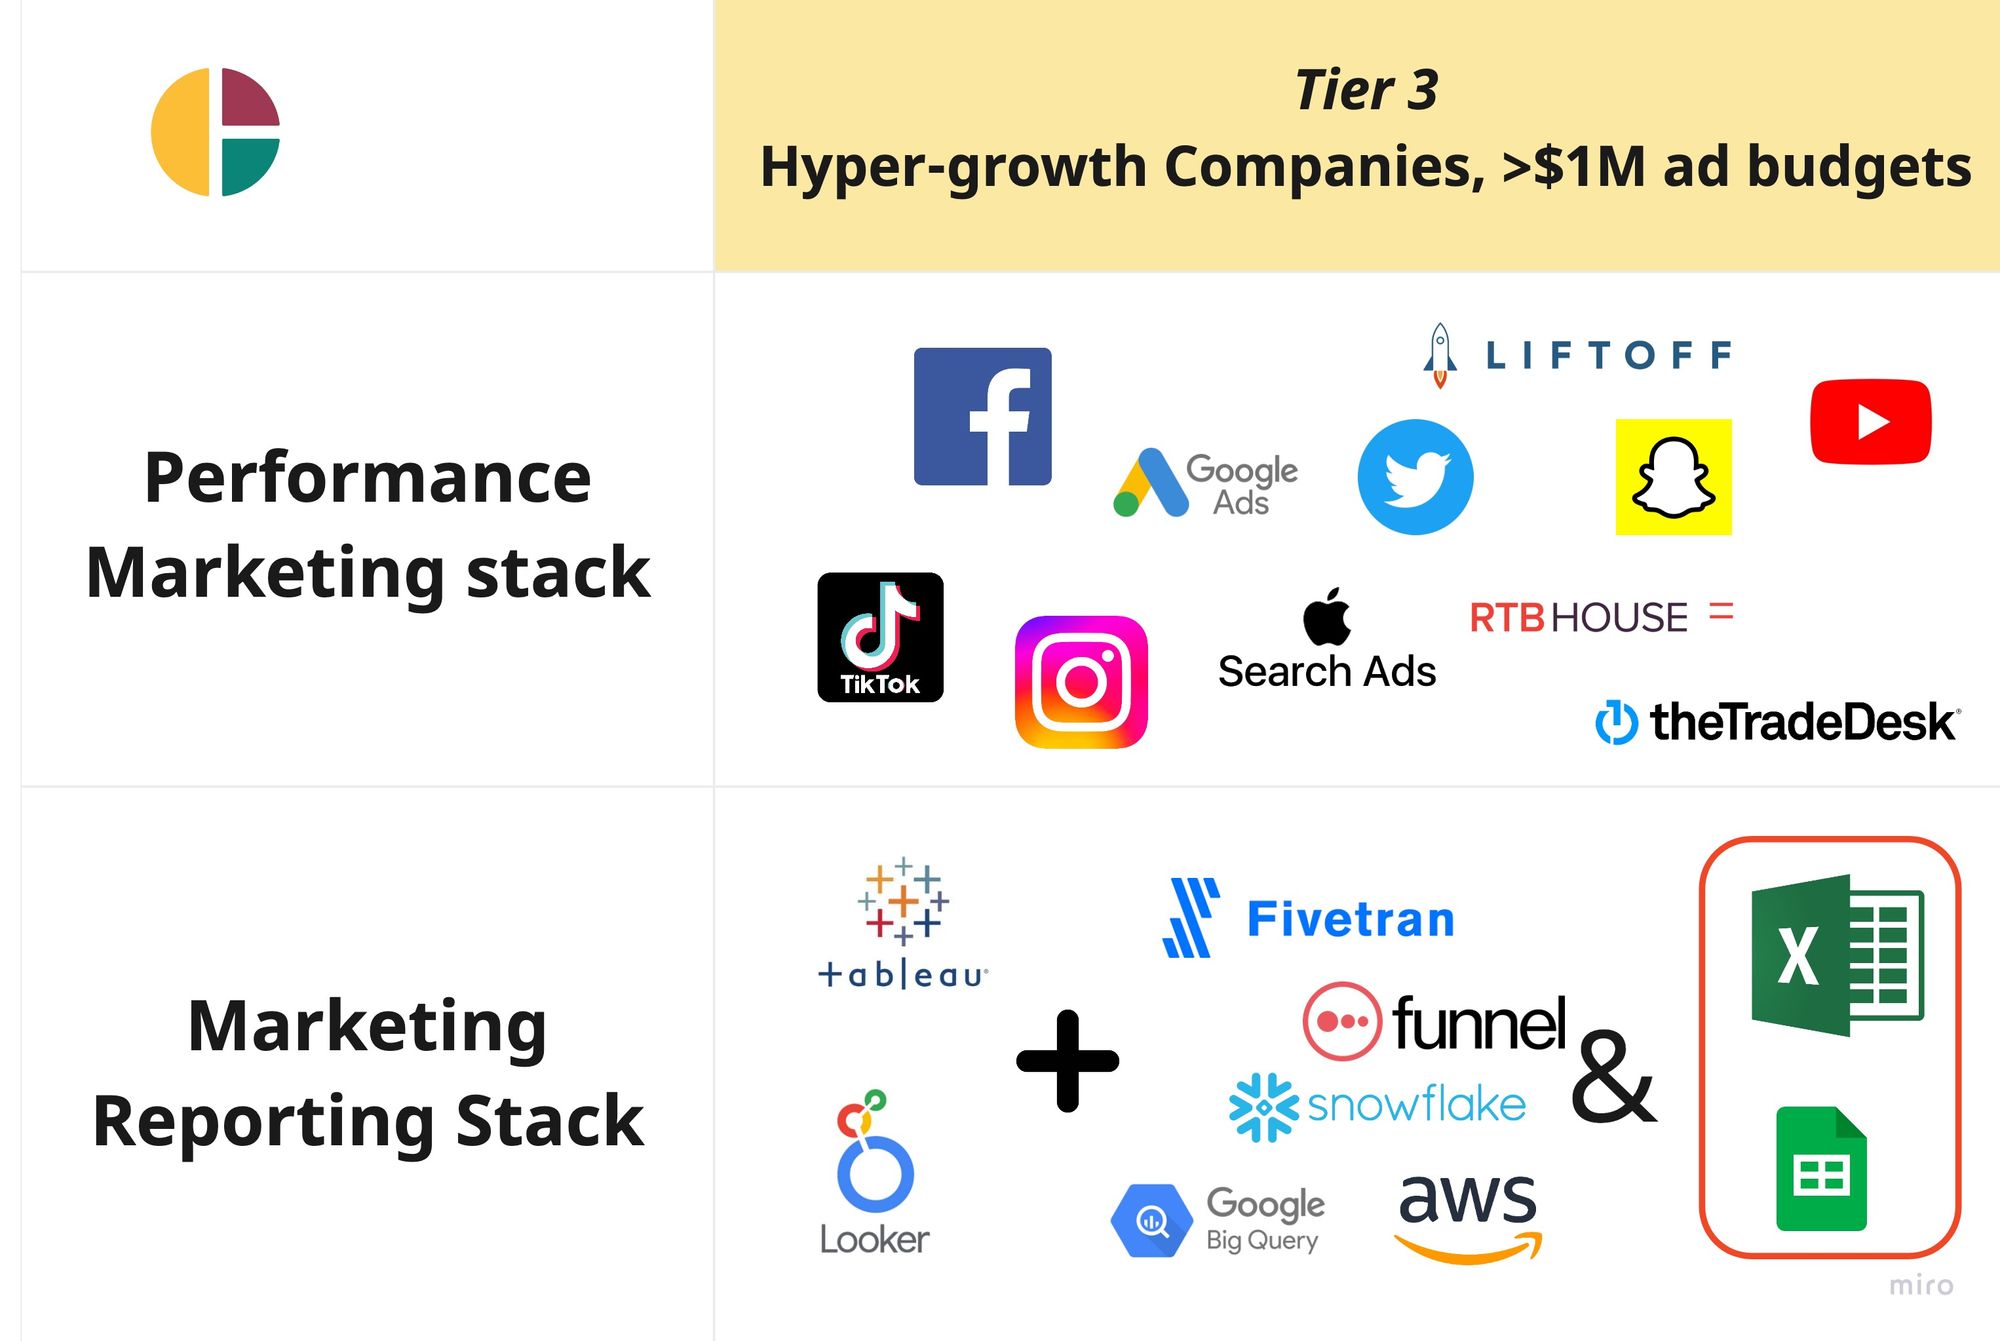
From Tier 2 to Tier 3 your business has grown exponentially. And then you notice something: your meetings are starting with arguments again. This is because the changing nature of your business has created new frustrations for both your Marketing Team and your Data Team. At the art of this is the defining transition that takes place between Tiers 2 and 3: From a mostly centralized data team to an increasingly decentralized data team.
Let’s delve into the new frustrations that accompany this transition, one team at a time.
Your Marketing Team is frustrated because the metrics they leverage have become more complex. Not only is CAC increasing for all customers, but your CAC is also probably showing different trends by time of customer, time of product unit and type of market. This means that different parts of the marketing team are looking at different metrics. Meanwhile, there is much more public scrutiny and pressure on the marketing function which is now spending substantial sums of money.
We see companies at this stage routinely spend over a million dollars on each marketing channel. Most channels such as Google and Meta will be saturated (pumping more money wouldn’t yield extra installs/orders), and you will start seeing diminishing returns (higher CAC).
What is adding to the frustration for marketers is the reporting stack. They are hitting the limits of pre-built dashboards. Marketers need more sophistication than ever before: budget forecasts, CAC by geo, CAC by customer type, market penetration insights, weekly pacing…
The arguments are back because your pre-built dashboards have become obsolete.

And this is why your Data Team is frustrated. As Marketing puts pressure on them for increasingly complex reports, Data Teams are slowly forced into doing low-quality, report-generation projects. Report-making is not what Data Teams sign up for in the first place. Plus they probably have to now work with a reporting stack that is not stable or scalable.
Thus you end up with Data Teams that are fighting with Marketing on the one hand, and the reporting stack on the other. (p.s. We have another piece coming up soon on what Clarisights means for Data Teams. Stay tuned!)
This is when, and why, marketers return to spreadsheets. Why waste time sending JIRA tickets to your data teams, when you can use VLookup and Pivot Tables to roll up your data and create fast, functional reports?
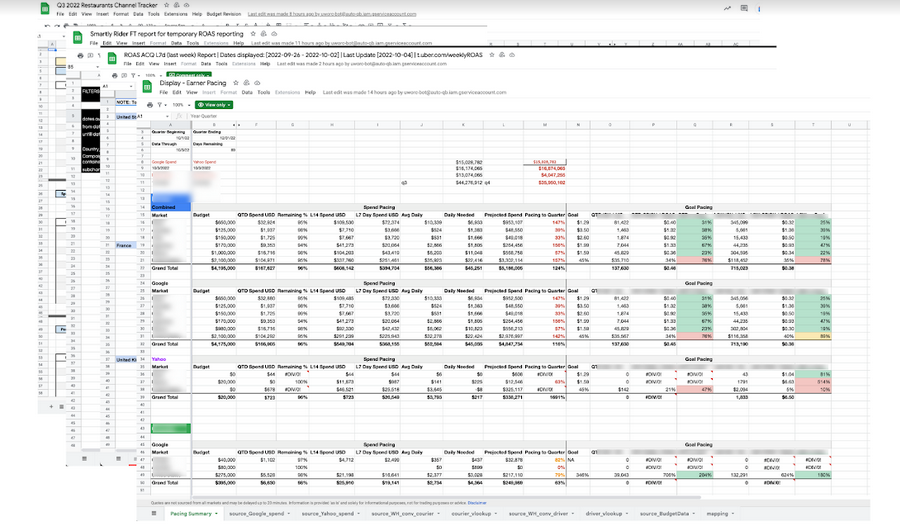
Which is great for marketers. But think of all the teams in the company and where they get their data from:
Your marketing team is working with spreadsheets. Your C-Suite is happy with the dashboards built by the data team and fed from the data warehouse. Meanwhile, other teams are scattered in between - some using spreadsheets and others still tapping into the data warehouse. What you end up with is a problem of centralized, aggregate data needs for the leadership, versus decentralized, granular data needs for the marketing teams and other operators.
Many of our users faced these issues. When we started working with Delivery Hero, only Search marketing reports were on Tableau whilst Paid social and App marketing reporting were done on spreadsheets. This is because connecting all these channels into Tableau isn’t a trivial job. And maintaining it (dimension/metric changes) is next to impossible task for the data team.
Where is the single source of truth that teams across the enterprise can collaborate on? This is one of the biggest issues for hyperscale companies. To solve it companies tend to throw data stack after data stack at the issue.
But we don’t believe this is the solution. Instead, what you need is specialist data tooling made for marketers. With an API-to-reports tool like Clarisights, and the organizational willingness to empower functional teams to drive reporting, Marketers can finally take back control of their data. They can finally work on a tool that marries the flexibility of spreadsheets with the scale and reliability of the Modern Data Stack.
If you are a Hyperscale company ready for real insight into your data, contact us!

