
Resolving metric dependency & expression with DAG & AST

At Clarisights, we are building an automated BI platform for enterprise performance marketing teams. Our goal is to help non-SQL literate business users to ask questions about their data at the deepest granularity without worrying about pipelines, data de-normalization or writing complex queries. We enable customers to create “custom metrics” which is a way for them to define KPIs (Key Performance Indicators) on top of base metrics from marketing data sources. These “custom metrics” are used to perform complex arithmetic and conditional operations on metrics across multiple data sources, and users can define them quite easily from the interface.
A typical query can have several custom metrics, each depending on other custom metrics and it can touch 10s of millions of rows per data source. The aggregated results from data sources go through 100s of thousands of complex expression evaluation while fulfilling interactive SLAs.
While it looks deceptively simple in UI, designing its architecture was a really complex problem to solve. We had to go through multiple iterations to get the computations right for nested, cross-channel queries and use multiple data structures such as AST — Abstract Syntax Tree to represent expressions and Directed Acyclic Graph to track dependencies of the metrics on one another.
V1 of Custom metrics
Our 1st version was extremely basic, it only allowed two operations ‘sum’ and ‘multiplication’ with no parentheses.
(a + b) * c had to be written as a * c + b * c
To define a ratio, the user had to specify numerator and denominator expressions separately, which is not particularly intuitive e.g. The expression (a / b) * c would be defined as:
{ numerator: "a * c", denominator: "b" }
Problems:
To calculate the values of metrics, they had to be broken into their dependencies for computations across multiple data sources. After computing the sum of each individual dependent metric across channels, the ratio is calculated to get the final value. This design failed when there was a need for creating nested custom metrics. If a metric has another custom metric as its dependency, it will report wrong values or zero since we don’t store the custom metrics, but calculate them on the fly i.e. the database has no info about the dependent custom metric.
Enter Recursion (V2):
We tackled some of the problems using recursion. In cases where a custom metric is a dependency, it is in-turn broken down to an expression consisting of the most basic metrics which are stored and aggregated directly in the DB.
Consider a calculated metric: cm = cm1 + cm2 where cm1 = base_metric1 + base_metric2 and cm2 = base_metric2 base_metric1 and base_metric2 are stored in DB collection The final expression of cm before the query goes to DB would be cm = base_metric1 + base_metric2 + base_metric2
We used the ruby gem dentaku which is the arithmetic & logical expression evaluation library. The recursion is performed on AST until it reaches the leaf nodes, which are base metrics. The limitations of V1 had also been addressed in this version such as adding support for brackets, deprecation of “numerator” and “denominator” — single string expression, support of all operators (+, -, *, /). In addition to this, on the fly validations were added to call out bad input.
While this was a significant improvement, as usage increased we found newer use cases that we had not accounted for in metrics, where a custom metric is a combination of base metrics from multiple different sources and is also a ratio. When the metric definition contains a ratio, the computation of the final value of the metric must not be part of the aggregation query as it will yield a calculated ratio of a metric that cannot be merged with the ratio of the same metric from another data source. Consider below example:
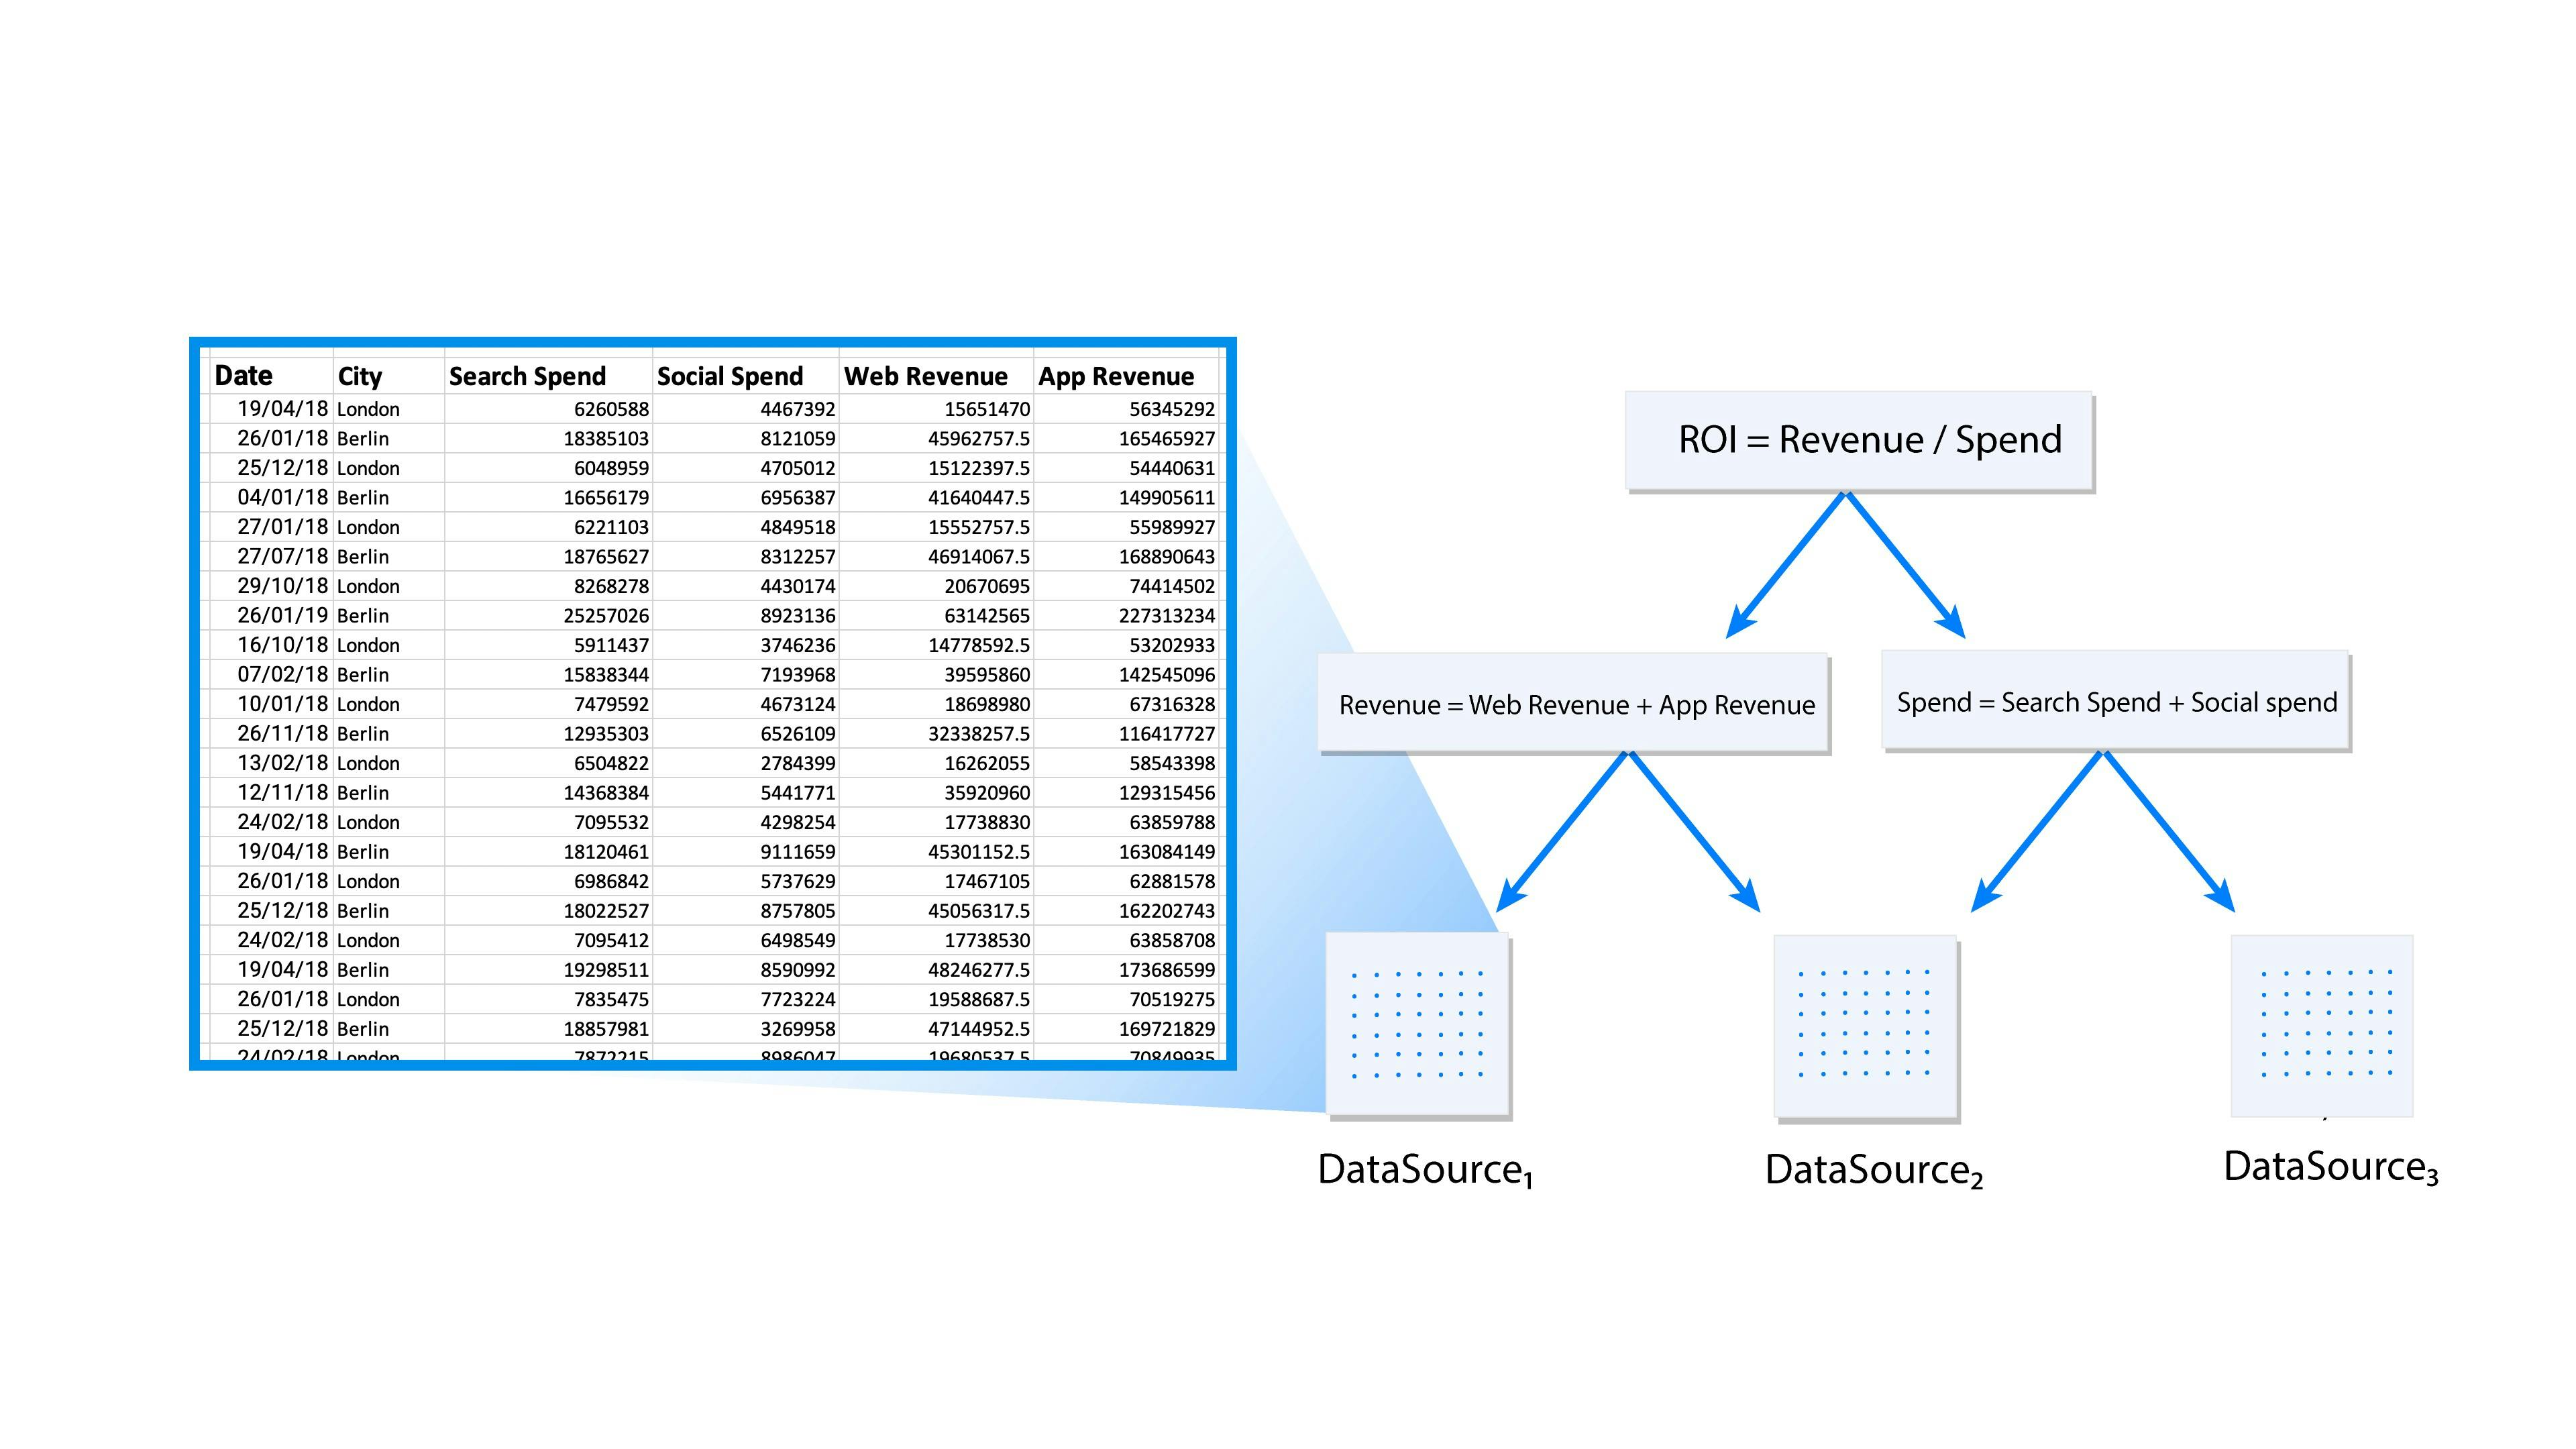
Expression: ROI = revenue / spend
revenue = web revenue + app revenue
spend = search spend + social spend
What happens in the V2:
- Facebook returns the computed number of revenue/spend; effectively (web revenue + app revenue)/(social spend)
- Google Ads returns the value of number of revenue/spend; effectively (web revenue + app revenue)/(search spend)
- Final result is Result(Facebook) + Result (Google Ads), which is clearly wrong as it's summing up two different ratios.
What ideally should happen:
- Facebook returns the value of – web revenue, app revenue and social spend separately
- Google Ads returns the value of – web revenue, app revenue and search spend separately
- Final value i.e. (web revenue + app revenue)/(search spend + social spend) is computed in Ruby instead of at DB level.
On to version 3
To address this, we designed our current system which uses topological sort of Directed Acyclic Graph to determine which dependent custom metric should be computed first in the hierarchy of nested metrics. In the above example; web revenue, app revenue, search spend and social spend has to be computed first — which goes into DB for the aggregation for each data source and both revenue and spend must be computed in application code based on the response from aggregate query to DB, before computing RoI (revenue/spend) in order to compute the final value.
Architecture
The custom metrics are not pre-calculated and stored while fetching the reports from API but are computed on-the-fly when the user opens a report which contains the custom metric. The primary reasons for this restriction are,
- The formula of the metrics can be changed at any point.
- The value of a custom metric is dependent on the arbitrary dimension groups & date ranges in the query.
The cross data source custom metrics need to follow the topological order in order to get the correct value. The diagram below explains what happens when the user makes a request for a custom metric. Here, we assume that the request contains only one nested custom metric having multiple levels of custom metric dependencies. Each node (A, B, C, D, E) represents a metric and the edge represents dependency of a metric on another.
When a group of custom metrics is requested, a dependency graph (DAG) is built, and the leaf nodes of the graph (Node E in the above image) are the base metrics. Once the graph is built, the leaf nodes (base metrics) are extracted and pushed to the per data source aggregator, which accumulates and returns the metrics grouped by selected dimensions in the given date range. Once the aggregated base metrics from all data sources are computed, they are seeded to topological sort iterator, which starting from the lowest level, computes the dependencies one-by-one before it computes the nested metrics.
This process assures that all dependencies of a custom metric are computed correctly, ensuring that the result of the last metric in the graph is also correct. However, it has its own limitations in terms of performance (in Ruby) and the operation that can be done on computed values like cross data source sorting and filtering, etc.
Performance
The performance of the metric computation directly depends on the degree of nesting in the custom metric. The topological sort iterator iterates over each node of the graph. A node of the graph represents either a requested metric, its direct or indirect dependencies, which are other custom metrics or the base metrics. The iterator starts from the base metrics and iterates over each node. The value of the current node in iterator is evaluated from the expression using ‘dentaku’ library. The values of base metrics are seeded into the evaluator initially, used for the evaluation of the first dependent node. The graph is then recursively compressed down to the requested custom metrics by evaluating each node. The evaluator assumes that it has all the values of variables — that are required to evaluate the node — seeded into it so that it can use them for further computations.
Now, if we take the above example, it has 3 levels of nesting (7 metrics in total). The last level is always base metrics, which form the starting point of the iterator. The base metrics are always computed by the aggregator at the DB level, so there’s no computation that the iterator needs to do. The iterator will loop over once for each subsequent metric and evaluate each metric separately in the graph. i.e.
level-1: web revenue, app revenue, social spend and search spend; level-2: revenue, spend; and level-3: RoI; for each aggregated row.
If there are 5000 rows, the total number of expression evaluations for this example will be 5000 rows * 7 iterations for metric evaluations per row = 35,000. In the worst case that we encountered, the total number of expression evaluations per row was around 65 — that means 3,25,000 evaluations (and lot more additional mathematical operation based on the expression internally handled by the dentaku library) per request. Given that it’s pure computation task and no IO operations are involved, there’s no way to run it concurrently because of GIL in Ruby as only one native thread can execute at a time.
To overcome this problem, we are exploring different options to move this part of the application. However, GIL continues to be the problem in Ruby-MRI, so we have moved this part to the immediate alternative JRuby in order to avoid rewriting this piece. We also get the advantage of the direct use of third-party Java libraries by using JRuby. Of course, we will face the issues from both Rails and JVM, but that should be manageable for now.
In Closing
The whole idea of breaking custom metrics into its dependencies and computing dependencies for each data source through DB aggregation, and then iterating over the topological graph to further compute nested metrics is because of the limitations on DB architecture level. We are using MongoDB as OLAP data storage and have separate collections for each data source. As a result, we need to collect the values of base metrics from each collection since sharded MongoDB doesn’t do joins well and we have to take care of the nesting on the application level as described above. We are not storing the data of all sources in a single collection due to operational constraints that are outside of the scope of this article. But we are exploring other solutions which will allow us to overcome these constraints. Our pipelines are read (aggregation) and update heavy, and our aggregation queries to MongoDB sometimes take minutes to respond even in a single channel collection.
We Are Hiring!
We are building something really exciting and have great customers, investors and lots of unsolved, hard engineering problems. We are hiring across roles in the backend, DB performance, and frontend teams. If you are looking for high-quality work and if you like what we are doing go ahead and apply here!