Postgresql — mysterious bad connections issue post Rails 5.2

The Problem
We have a Rails backend and use Postgresql as our OLTP DB. About a month back, we moved to Rails 5.2. Ever since we noticed that our queries to PG in our background jobs will randomly fail. Errors would look like PG::ConnectionBad: PQconsumeInput(). These errors, in particular, used to come when we used to do find-each on large tables. So we thought maybe queries are taking time and we need to optimize them. But then the error started appearing randomly in almost every job regardless of table size. This is when we realized that it has nothing to do with our background jobs but more of a server issue. Since we have thousands of jobs running throughout the day, we use PGBouncer to manage the number of connections we open to PG. In the pre-Rails 5.2 world, we were using transaction-based pooling in PGBouncer and our max connections to PG was a mere 25. Hence we never had this problem. But after Rails 5.2, we were forced to move to session pooling as 5.2 started throwing errors and our migrations were failing. In session pooling mode, PGBouncer needs to open a lot more connections to PG than before. Hence we changed the max-connections in postgresql.conf to 1000 post Rails 5.2 upgrade. Things were fine initially but as mentioned earlier, we started seeing PG connection bad issue repeatedly across all our jobs.
Failed attempts at diagnosis
The mystery was deepening and Stackoverflow, Google, Github issues were not turning up a concrete answer to the problem that we were facing. In a few places, we were missing indexes, so we optimized the queries by adding a proper index. Still, the problem won’t go away. We then tried adding retry logic around some of our batch paginated calls — it helped a bit but it was irritable that we had to put begin/rescue around each of the query blocks to catch exceptions and we were unwilling to accept that as a solution as it was more of a hack than really understanding what was going on.
The Voila Moment
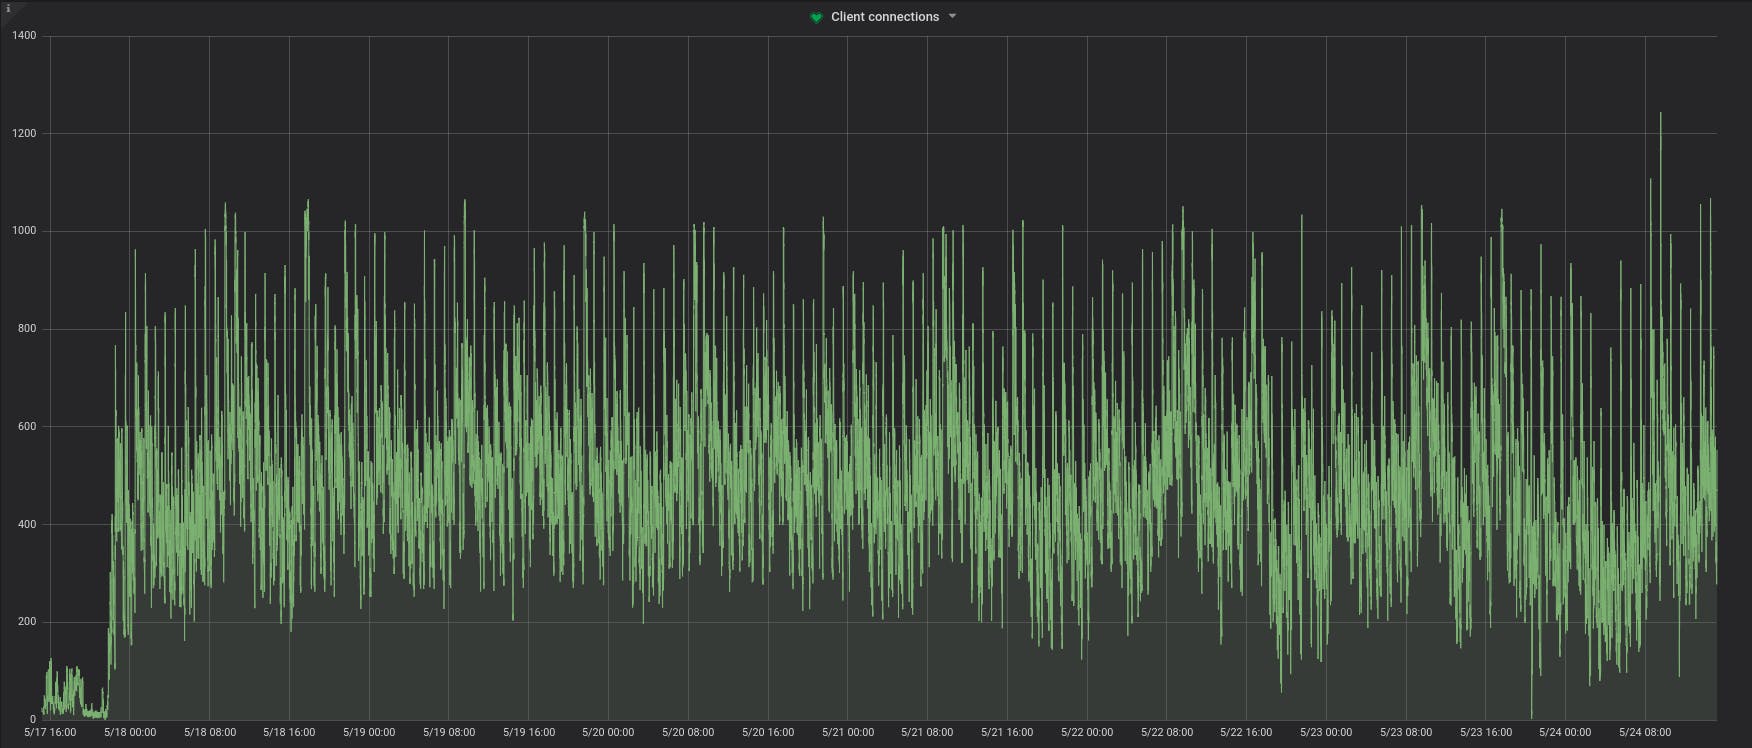
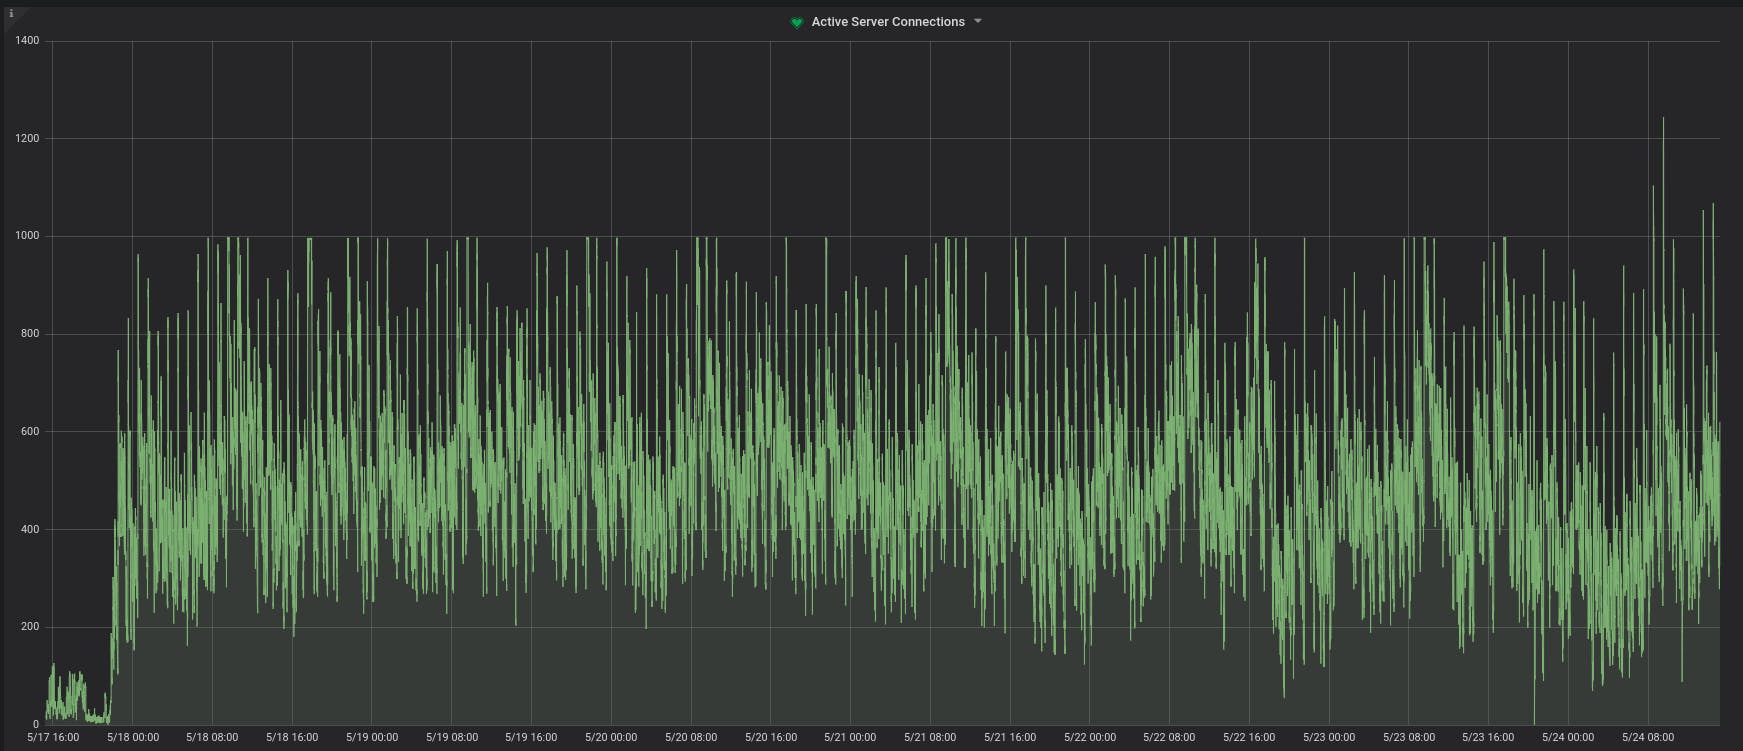
We looked at various monitoring graphs in Grafana where we track PGBouncer and PG health. We stumbled upon two graphs that kind of nailed the culprit. The number of client connections to PGBouncer and the number of active connections to PG from PGBouncer. We noticed while the former was crossing 1k, the latter seem to have a hard stop at 1k and would never cross it. Bingo! We knew something is wrong here and we found max-connections in postgresql.conf was set to 1k. Of course, one month had passed since we had set the max-connections in postgresql.conf to 1k and we had completely forgotten about it!


The Solution
It's kinda obvious what we had to do. Just increase the max_connections in postgresql.conf to a higher number (we chose to set it to 3k, the same value that we have set in PGBouncer for max client connections). You will notice that after 23rd May evening, active server connections started going beyond 1k (we added the fix around that time) and our Sentry which was flooded with PG bad connection errors suddenly fell silent! Note that while the solution was trivial, from the errors we saw, it wasn’t obvious that PG was dropping our connections because of the max limit. Parting Thoughts — Monitoring is important! Debugging this would have been a nightmare if we didn’t have the health graphs — in particular, the connections count. So, we highly encourage to have enough monitoring in place for your services unless your services never fail and you know they will never fail :)
