
2024 at Clarisights: Five New Features That Changed The Way Teams Work With Marketing Data

2024 was an incredible year at Clarisights. We had yet another year providing our customers with features that change the way they work, creating efficiencies and creative solutions for hyperscale companies across the world. Product Manager at Clarisights, Ritvik Singhvi, takes us through the standout examples.
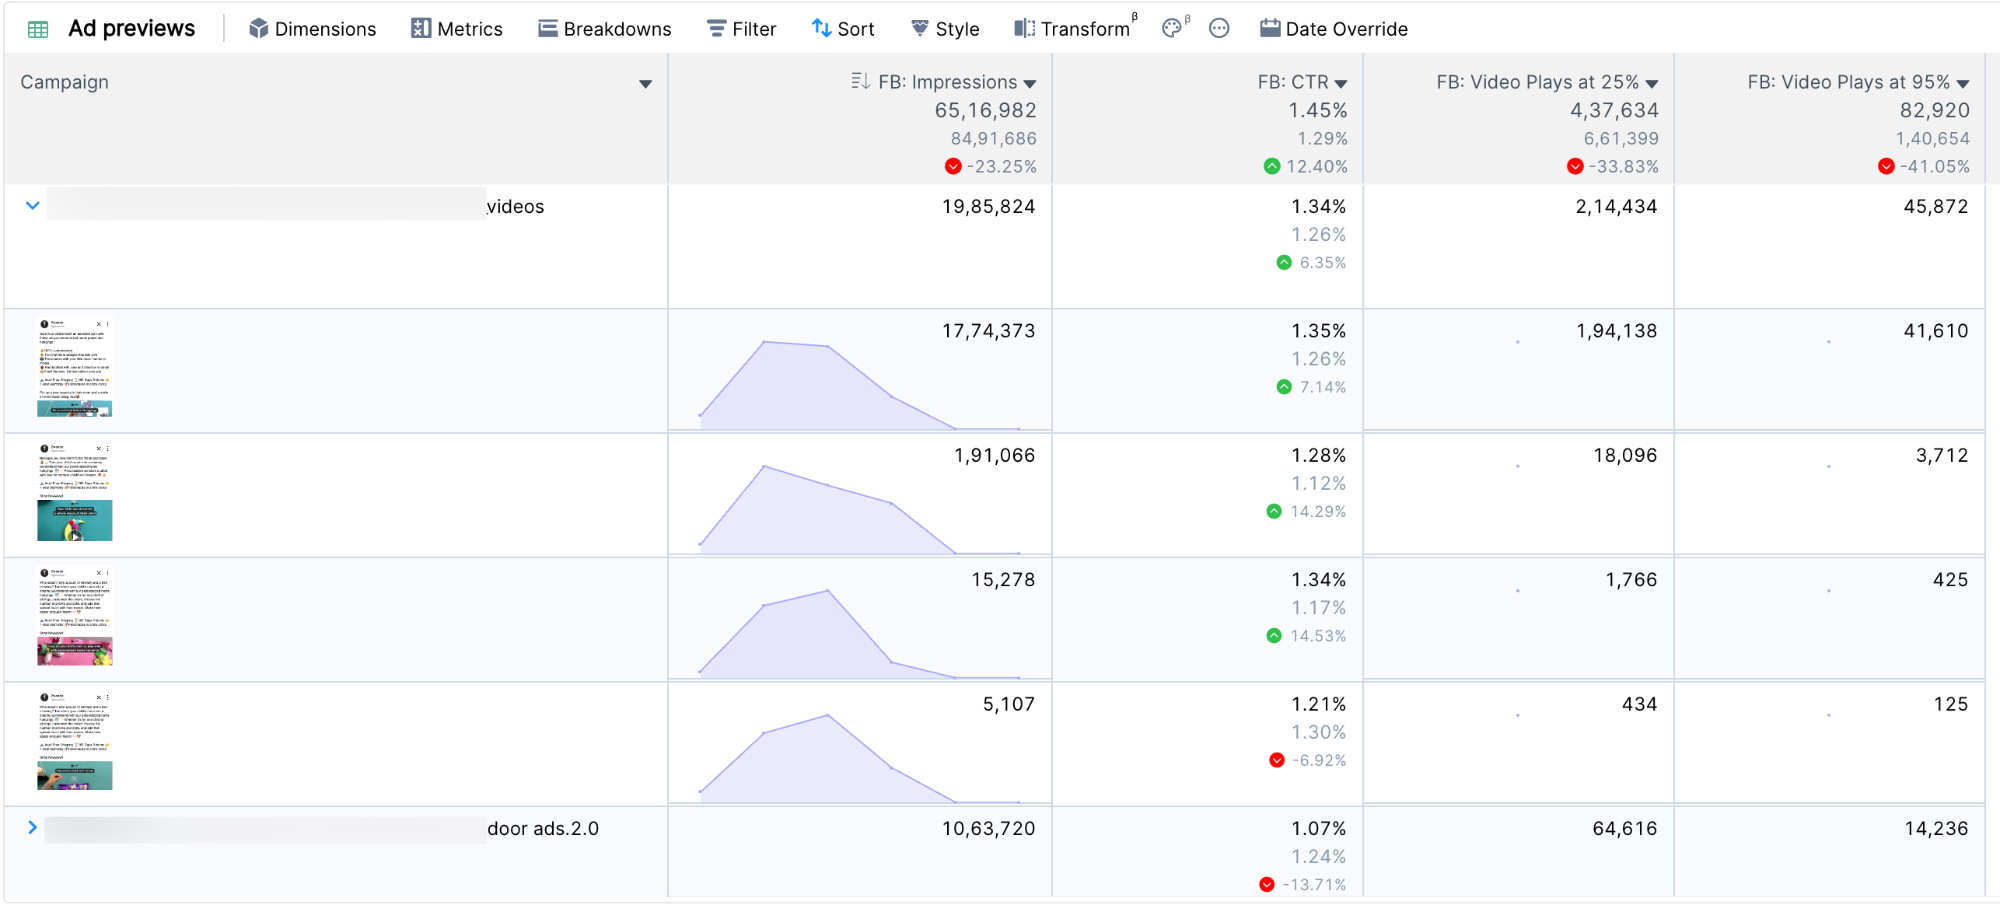
1. Creative Previews: Making Creative Performance Visible
Market Context
Google and Facebook's shift toward automated ad serving has fundamentally changed how marketing teams work. As platforms take control of audience targeting and bidding through tools like Performance Max, creative assets have become one of the last meaningful levers for differentiation. Teams now focus on testing multiple creative concepts - a holiday campaign might explore everything from gift-giving moments to family gatherings - but analysing how these concepts perform has become increasingly complex.
Customer Challenge
A growing emphasis on creative optimisation has exposed gaps in marketers’ workflows. Teams waste hours switching between platforms - checking creative assets in one tool, performance data in another, and maintaining spreadsheets to connect the two. Design teams produce variations but can't easily see how their work performs in the market. Brand managers struggle to maintain consistency across thousands of ads, while marketing leaders lack a clear way to audit creative execution at scale.
The traditional solution of taking screenshots and documenting performance in spreadsheets worked when teams managed dozens of ads. But with companies now running thousands of creative variations across multiple concepts, this manual approach has become untenable.
Our Solution
Creative Previews rethinks how teams interact with creative assets in their analytics workflow. Building this required solving several technical challenges. Facebook's API, for instance, only provides temporary URLs for ad previews, making simple image caching impossible. We built a sophisticated system that handles dynamic loading and caching of thousands of ad previews while managing API rate limits and maintaining smooth UI performance.
The system connects to various ad formats beyond standard ads, including automated ads and product ads, providing a comprehensive view of all creative assets in market. This required building robust handling for different ad formats while ensuring consistent performance even when dealing with thousands of rows of data.
Impact
For marketing teams, this has transformed creative workflow:
- Instant visibility into creative performance across channels
- Ability to analyse concepts holistically rather than ad-by-ad
- Direct feedback loop between design teams and performance data
- Simplified creative auditing for brand consistency
- Hours saved previously spent capturing and documenting creative assets
- Replacing your Powerpoints slides by snapshotting ad previews and using Clarisights as the platform to present
2. Marginal Comparison: Understanding the Value of Every Marketing Dollar
Market Context
For e-commerce companies scaling their marketing investments, understanding aggregate performance isn't enough. Teams need to know the specific return on each additional dollar spent, especially during high-stakes periods like sales events or major campaign launches. This granular understanding of incremental performance has become crucial for optimising spend across channels.
Customer Challenge
About You, like many e-commerce companies, struggled with optimising marketing spend at scale. Their teams needed to understand how each additional investment impacted revenue, particularly during sale periods when spending decisions had to be made quickly. The existing process involved complex spreadsheet calculations and custom queries in tools like Looker, neither of which provided the speed or reliability needed for effective decision-making. Different teams often used varying calculation methods, leading to inconsistent results and delayed decisions.
Our Solution
Marginal Comparison automates the analysis of incremental performance metrics. The system handles any numerator/denominator relationship - whether it's ROAS, Cost per Sale, or custom efficiency metrics - and compares current-period performance against historical baselines. It automatically accounts for seasonal variations and updates in real-time as new data flows in, ensuring teams always work with the latest information.
More importantly, it standardises these calculations across the organisation. Instead of different teams maintaining their own spreadsheet versions of marginal calculations, everyone works from the same methodology, enabling consistent decision-making across channels and campaigns.
Impact
For e-commerce teams, this has transformed budget optimisation:
- Instant insight into incremental performance across channels
- Confident budget allocation based on actual marginal returns
- Elimination of manual spreadsheet maintenance and maintaining a single source of truth for all marketers in the company
- Consistent measurement methodology across teams
- Faster optimisation decisions during critical sales periods
3. VLOOKUP: Solving the Data Quality Challenge
Market Context
Maintaining data quality has become increasingly challenging as marketing campaigns grow more sophisticated. The traditional approach of using manual rules and naming conventions breaks down when dealing with thousands of campaigns across multiple channels. Companies need systematic ways to maintain data consistency without relying on human-generated keys and manual data cleaning.
Customer Challenge
Universal Music Group's experience illustrates the complexity of modern campaign data management. Their teams managed campaigns for numerous artists, each with its own naming conventions and metadata requirements. The traditional approach of maintaining rules and filters in spreadsheets was becoming unsustainable. When campaign names contained errors or inconsistencies, reports would break. Teams spent hours manually cleaning data and maintaining lookup tables, time that could have been better spent on analysis.
Our Solution
Rather than simply recreating spreadsheet VLOOKUP functionality, we fundamentally rethought how teams manage campaign data. Our solution uses unique identifiers instead of human-generated keys, enabling consistent data management even as campaigns scale. The system automatically maintains mapping tables that connect campaign IDs with their associated metadata, eliminating the need for manual rules and filters.

This approach goes beyond simple data matching. The system includes automated quality checks that flag inconsistencies and errors before they affect reporting. Teams can store and manage rich metadata for each campaign, making it easy to analyse performance across different dimensions without maintaining complex naming conventions.
Impact
The new approach has transformed how teams manage campaign data:
- Dramatic improvement in data quality without increased manual effort
- Automated error detection before issues affect reporting
- Simplified campaign management across channels
- Consistent data structure across the organisation
- Reduced time spent on data cleaning and maintenance
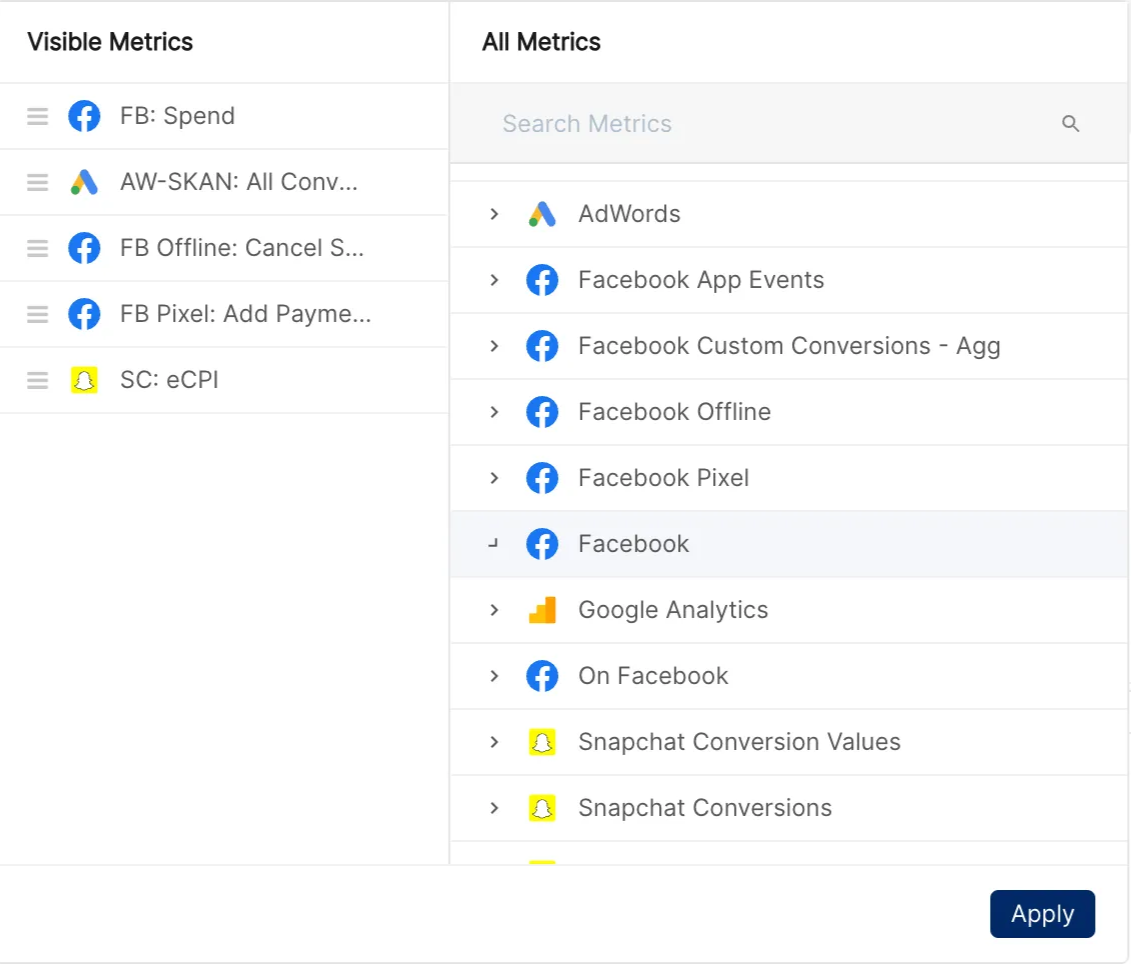
4. Metric Search: Bringing Clarity to Complex Data
Market Context
Modern marketing teams work with an increasingly complex array of metrics. What looks like a simple concept like "revenue" or "conversion" often exists in multiple versions across different platforms. Facebook's view of performance differs from Google Analytics, which differs again from internal attribution systems. Teams need ways to navigate this complexity without getting lost in the details.
Customer Challenge
As companies connect more data sources to Clarisights, the number of available metrics grows exponentially. Marketing teams struggle to find the right metrics for their specific needs, often creating duplicate calculations simply because they couldn't find existing ones. The problem goes beyond search - teams need to understand where metrics come from, how they're calculated, and when they should be used.
Our Solution
Our new metric management system doesn't just help teams find metrics - it helps them understand them. Every metric now includes detailed metadata about its source, calculation method, and appropriate use cases. Teams can organise metrics into logical groups that match their workflow, making it easier to find relevant metrics for specific tasks.
The system also provides visibility into how metrics are used across the organisation. Teams can see which metrics are most commonly used in reports, who created them, and when they were last updated. This helps maintain clean, reliable reporting by making it easy to identify and deprecate outdated or redundant metrics.
Impact
The new system has transformed how teams work with metrics:
- Significantly reduced time spent searching for appropriate metrics
- Better understanding of metric relationships and appropriate use
- Reduced creation of duplicate metrics
- More efficient organisation of reporting workflows
- Improved consistency in cross-team reporting
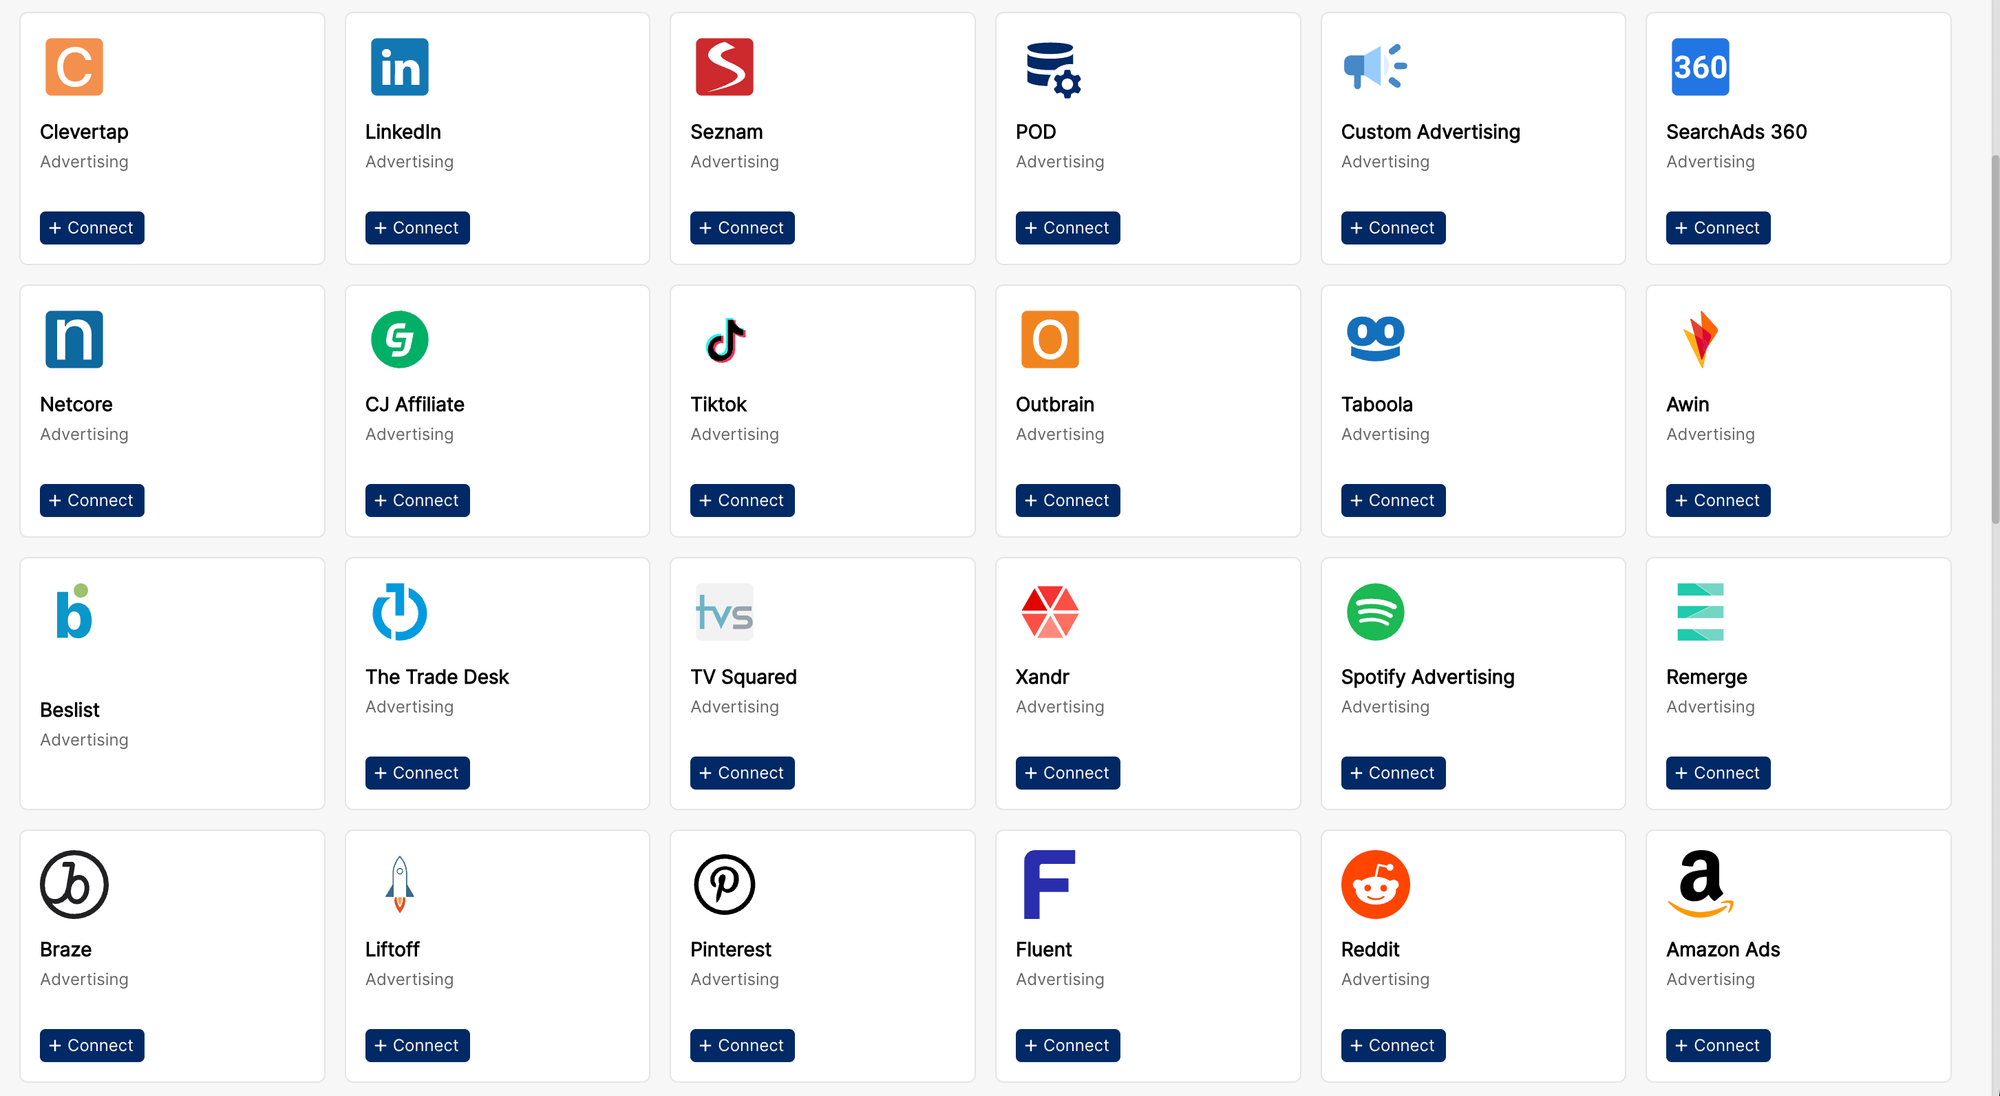
5. New Integrations: Redefining Cross-Channel Data Integration
Market Context
When marketing teams expand into new channels like LinkedIn, Reddit, or Pinterest, they face a fundamental challenge. Each platform structures data differently, defines metrics differently, and organises campaigns differently. Most analytics tools approach this by simply pulling raw data from each platform - but access to data isn't the same as making that data useful.
Customer Challenge
The complexity goes far beyond just connecting to different platforms. What's called a "ad set" in Facebook might mean something entirely different in Google Ads. Revenue tracking in one platform might include different components than in another. Teams end up spending countless hours trying to normalise this data manually, often maintaining complex transformation pipelines just to make cross-channel comparison possible.
Our Solution
At Clarisights, we take a fundamentally different approach to integrations. When we add support for a new platform, we're not just building a connector - we're creating a sophisticated data model that makes the platform's data truly useful in a cross-channel context. Our newest integrations with LinkedIn, Reddit, Pinterest, and Amazon Ads reflect this philosophy.
This process involves deep technical work at multiple levels. First, we analyse how each platform structures its data and metrics, understanding not just what data is available but how it's meant to be used. Then, we build a comprehensive data model that maps this platform-specific structure into our unified data model, ensuring concepts like "campaign" or "revenue" mean the same thing regardless of source.
The engineering challenge is significant. We're often dealing with hundreds of millions of rows of data per day per customer, requiring sophisticated systems for data processing and storage. Our integrations need to handle not just the volume of data, but also platform-specific challenges like API rate limits, authentication flows, and varying data freshness requirements.
Impact
This approach to integrations has transformed how teams manage multi-channel campaigns:
- True cross-channel analysis without maintaining complex data pipelines
- Confident budget allocation based on normalised cross-channel data
- Analysis at any level of granularity across all channels
- Consistent metric definitions across platforms
- Focus on strategic analysis rather than data preparation
Looking Ahead
As we move further into 2025, we're focusing on several ambitious projects to transform marketing analytics further. We're expanding our creative analysis capabilities, completely rebuilding our table architecture for enhanced performance, and developing a next-generation integrations framework.
Our goal remains consistent: to help marketing teams make better decisions faster, while eliminating the manual work that often slows them down. The features we launched in 2024 are just the beginning of this journey.