
Our New Identity - Clarisights

We have all been there. You stay up all night preparing the presentation for your monthly marketing review and you show up thinking you have every question covered, until that one person in the meeting who asks a seemingly innocuous question that has you dumbfounded like “What were the best performing creatives and can you break it down by retention and prospecting?” Or “It’s great that you have day-wise data but can you roll it up by weeks and compare it to the previous month?” Not so easy huh?
Not much different is it? Despite rapidly proliferating platforms, channels and analytics; the way we look at data and the tools we have at our disposal have been the same.
We wanted to build a product to help marketers manage their ever-increasing data sources. This is not a new problem and many have tried to tackle it in the past. Unfortunately, the solutions are far from adequate, marketers are either stuck with little widgets which are painfully inadequate or investing in a small army of engineers + analysts to build a data warehouse and then layering a BI interface to view this data.
When we started exploring this problem pretty much every marketer we spoke to agreed that the problem was valid but was divided on the solutions. Many recommended just sticking to building data pipelines and letting companies use existing BI products like Tableau to visualize their data.
Our goal though was a lot more ambitious. We wanted to enable true self-service Analytics for Marketers, as the constant back and forth between Marketing and data teams could only be solved by letting Marketers have control of their data.
To enable self-service analytics we realized that the ideal way to tackle this problem is not to look at the interface and data store as independent pieces but as one integrated solution. This would allow us to build a product that was contextual for marketers and also powerful enough to help them really play around with their data without ever worrying about learning SQL or worrying about inner joins, outer joins or n+1 queries. It was a risky choice for a startup as we were going after multiple categories at once. Data Collection, Data Clean-up, Warehouses, and Visualization, but we decided to swing for the fences.
We put together an MVP and worked with a couple of early customers who were extremely savvy and demanding. They were excited about our vision and were patient enough to work with us as we worked through the glitches and ironing out the product and even pay us for it!
While the product “worked” we knew there was more work to be done before we could roll it out to a larger group of customers. For the last couple of months, we have been hard at work and we are finally ready to launch.
While it’s hard to remain objective we are incredibly proud of what we built and we can’t wait to share it with you. We are calling it Clarisights.
The success of Coda and Airtable tells us that strong incumbents can be challenged and they have been a great source of inspiration for us.
On to some details!
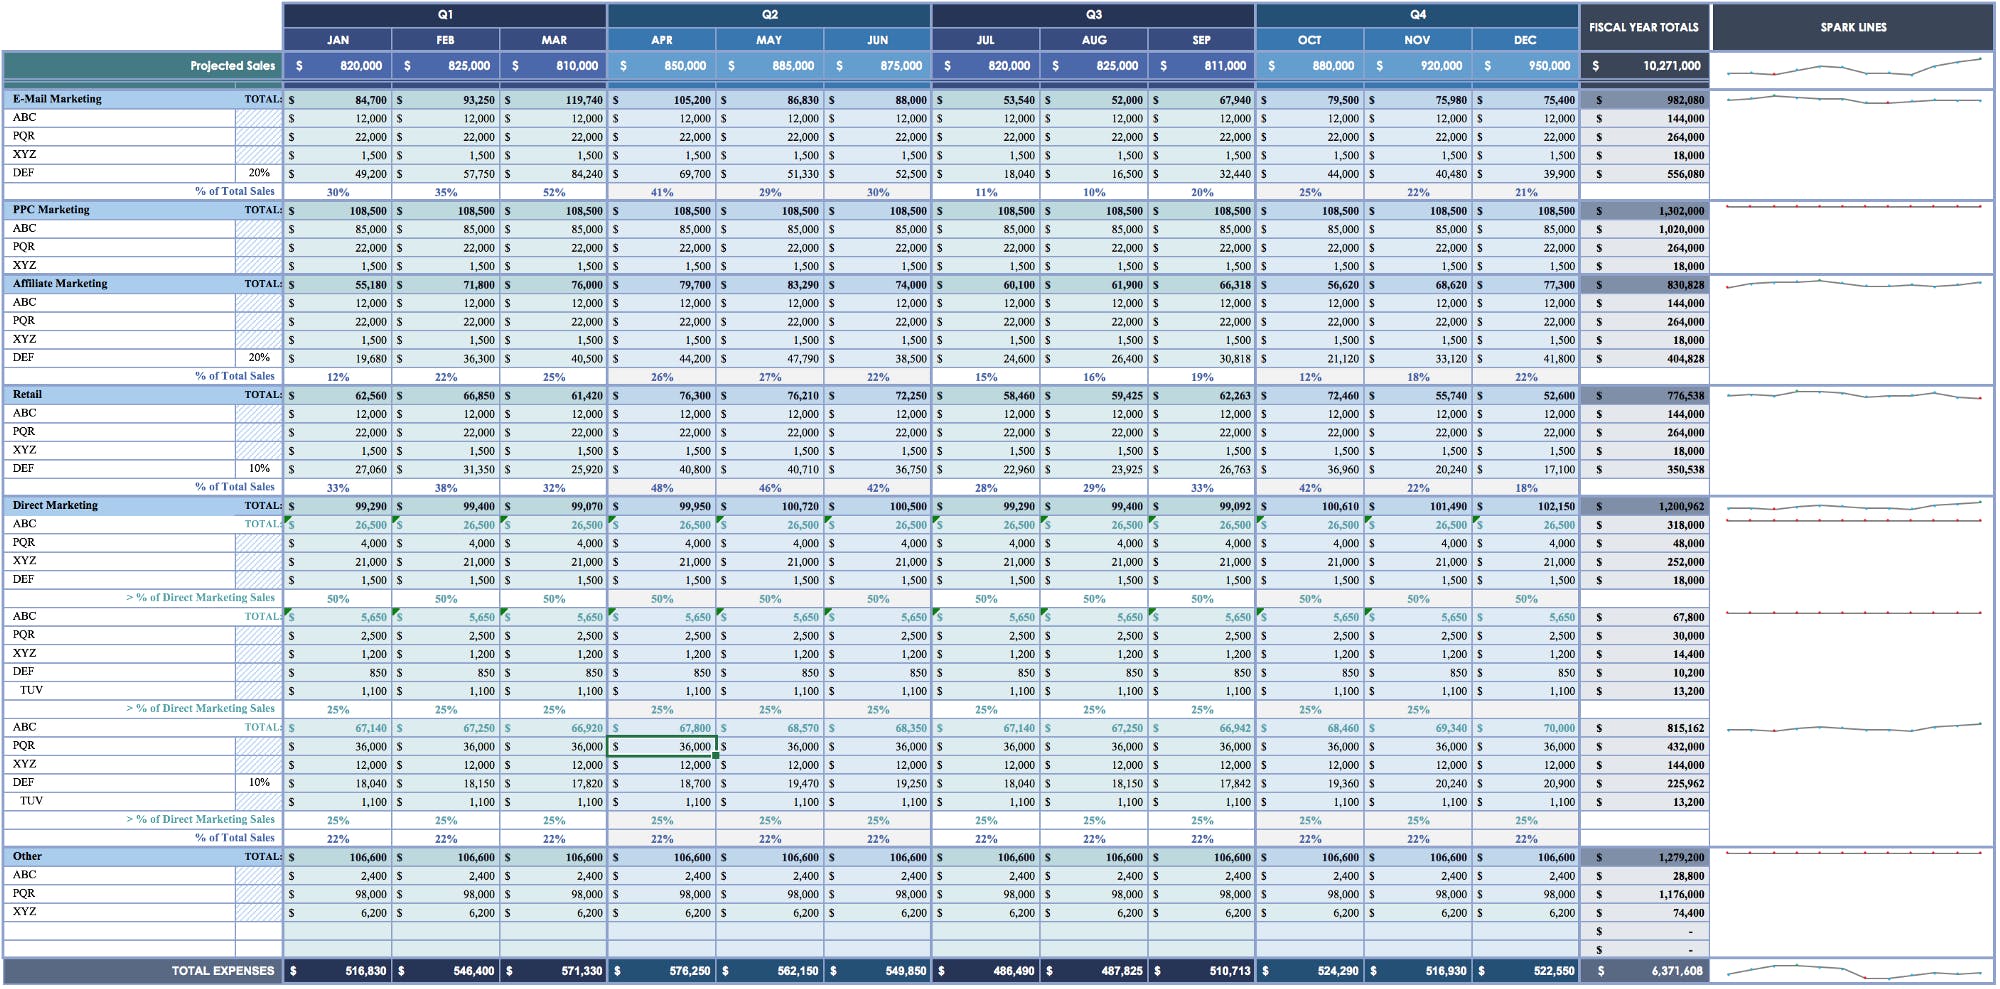
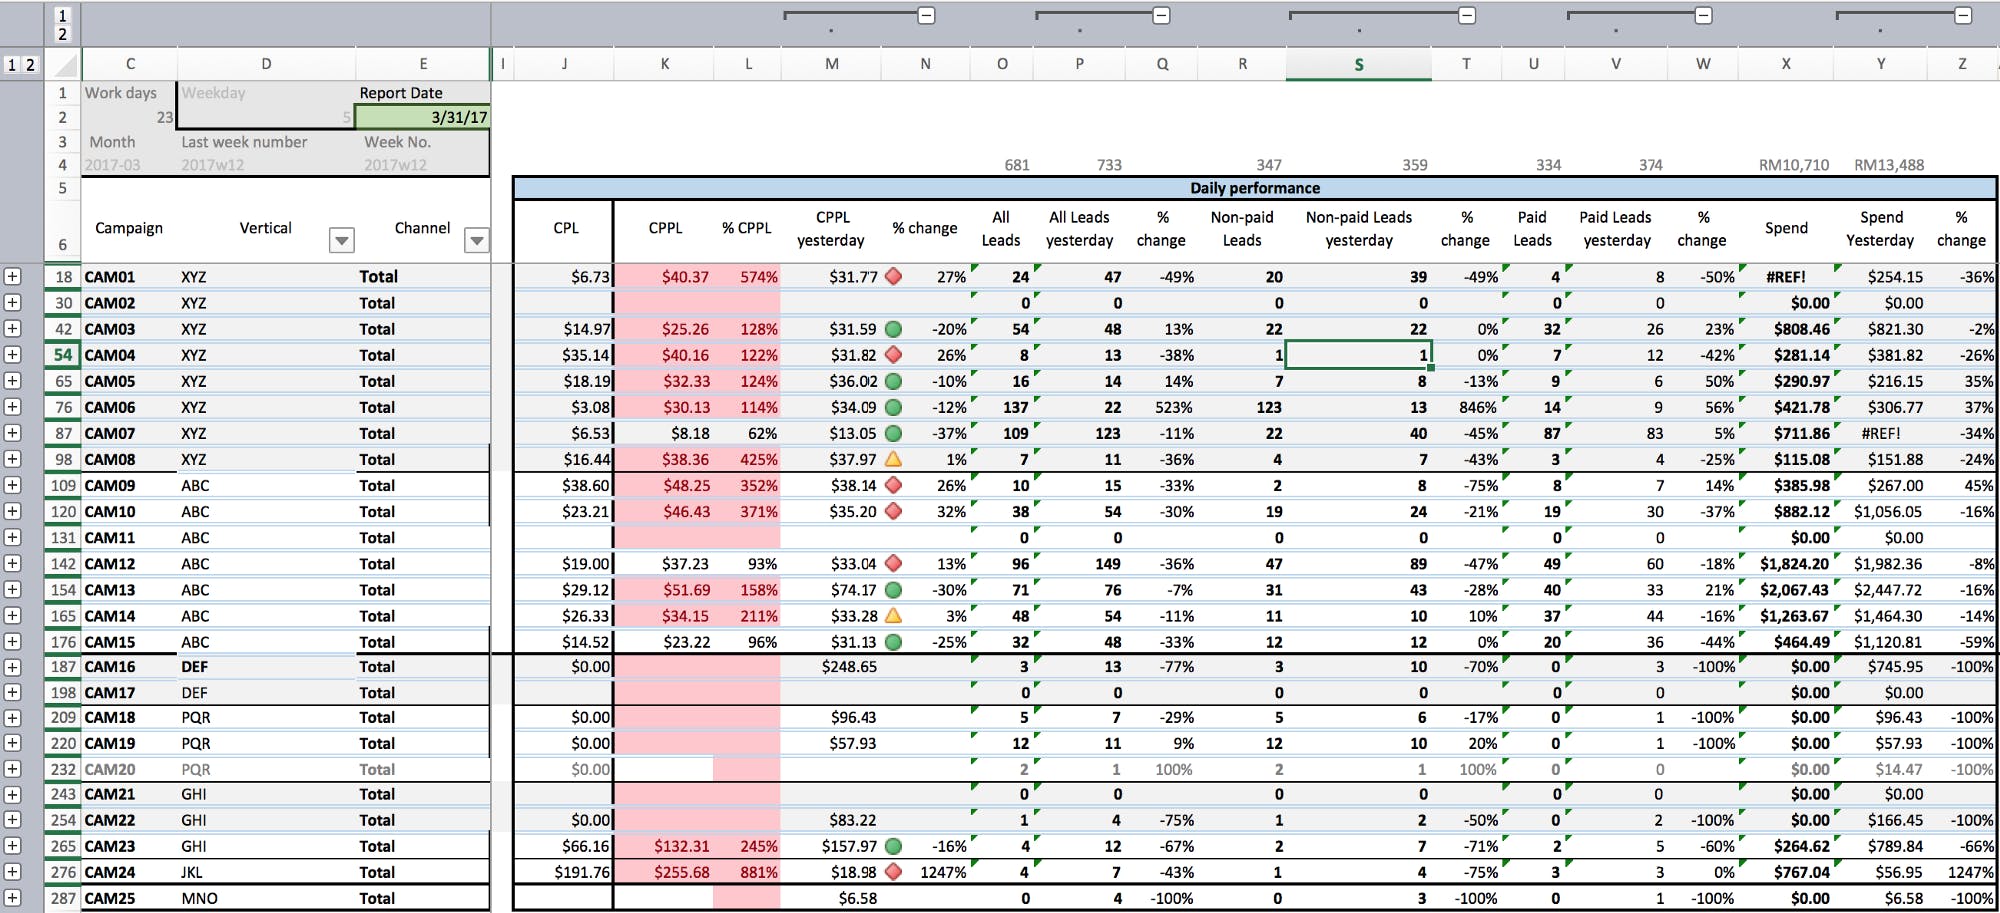
We didn’t want marketers to live in a world of compromises. If you wanted granular data you had to go to Excel or Google Sheets, want to create charts or visualization switch to Google Data Studio or Tableau. Have a monthly review? Go to Powerpoint and spend a day pasting creatives and other data points.
We really wanted to go after these limitations.
- It’s the most powerful table outside of a spreadsheet. Want to roll up day wise data to weeks, months or quarter? Easy peasy.
- Want to actually look at the creatives running on your channels and break down performance by region, audience or campaigns? Done and done!
- Would you like to see FB Pixel No.s and compare it with Google Analytics/BigQuery or Appsflyer all in one table? You got it!
- Want to create your own metrics to see how you are measuring up to your monthly targets? All in one place.
We built powerful collaboration as well. For example, you can now automatically schedule creative reports that are auto-updated so your design team can really tell the impact of adding a call to action.
All this with the confidence that all your data across all channels is being piped in at the most granular level automagically mapped to your web or mobile analytics channels or internal transaction DB. To ensure you have a real-time view of your data, we auto-update data at 15/30 min intervals.
We are confident you will enjoy working with Clarisights and while it would be presumptuous to say that we have are the best product out there for marketing reporting, if you do decide to give Clarisights a spin, we are sure you will appreciate the level of detail that went into building it.
We are working with a mix of clients as one of the world’s largest performance agencies, some of the fastest-growing e-tailers, education and streaming providers. The fact that our customers come from different categories and regions tells us that we are solving a global problem, if you want to give us a go, write to us!