
Introducing PHPA: Our Kubernetes Horizontal Pod Autoscaler


At Clarisights, we run all of our stateless workloads on Kubernetes and utilize Graphite and InfluxDB for monitoring.
As every other software company, we also see uneven traffic spikes from the user activities and batch jobs. To handle this, we used to provision for peak capacity but that meant most of the time, our servers were sitting idle doing absolutely nothing. We saw this as an opportunity to save costs, and hence explored ways to auto-scale based on demand.
We looked at Kubernetes’ default Horizontal Pod Autoscaler(HPA) but we found that it only scales based on CPU and Memory usage whereas our needs were different. We wanted to scale based on metrics present in our monitoring systems (Graphite and InfluxDB). After looking into custom metrics for HPA, we figured out that it was very complicated, was mostly tied to Prometheus, didn’t have great support for Graphite, and also required knowledge of GoLang.😕
Also during the time, Knative was released. After looking into it, we figured out that it was still in alpha and required running multiple components, which would eventually result in operational complexity.
Hence, during an internal Hackathon at Clarisights, we decided to take a stab at this problem and wrote PHPA (Poorman’s Horizontal Pod Autoscaler)*. After a few hours of hacking, we had an initial version of PHPA ready.
How does it even work? 🤔
The way the most Autoscalers work is that they have the desired state, a current state, and a set of actions when the desired state is not equal to the current state. Autoscaler continuously evaluates the difference between the current and desired state and based on the results, it performs certain actions. This process of continuous evaluation is called the Reconciliation loop.
In our case, PHPA does following things in reconciliation loop —
- Get Current Metric Value ⏬ - gets the value of a metric from Metric Server. (i.e. Graphite, InfluxDB)
- Decide and Take An Action 🤔 - in this phase, it looks at the value of the metric and then decides an action that can be “Scale Up”, “Scale Down” or “Do Nothing”.
- Sleep for interval + Cooldown 😴- sleep for configured interval time + cooldown, cooldown is zero in the case when “Do Nothing” action is taken, otherwise "cool down” time that was configured via actionCooldown.
- Repeat 🔁
Config and Controls 🎛️
PHPA is highly configurable, it just takes a YAML file for configuration. PHPA config file's structure is inspired by and modeled after Kubernetes Objects (it’s not a CRD).
You can run a single copy of PHPA which targets multiple deployments in a cluster and pass a config folder with YAML config files for each deployment. Demo configs and deployment are available here.
Example config file
version: 'v1' # -> # PHPA version
kind: 'PHPAConfig' # Indicates that it's PHPA config file and not any random yaml file
verbose: 'true' # controls log level
dryRun: 'true' # when set to true, don't actully perfrom actions, just show them in logs
actionCooldown: '120' # cool down time(in seconds) after performing an action aka scale up or down
interval: '60' # interval (in seconds) between reconciliations
deployment: # info about target deployment which we will auto-scale
  name: 'production-precomputation-consumer' # name of deployment
  namespace: 'precomputation-consumer' # namespace of deployment
  minReplicas: '1' # minimum number of replicas
  maxReplicas: '32' # maximun number of replicas
  fallbackReplicas: '10' # fallback replicas in case we fail to get current metric value
metric:
  # This config block contains configs which are used to decide an action
  # based on metric value
  name: 'precomputation_consumer_lag'   # name of metric, used to identify metric in logs
  metricType: 'negative'
  metricThreshold: '1500000'
  metricMargin: '100000'
metricServer:
  adaptor: 'graphite'
  graphite:
    host: 'graphite-1'
    port: '80'
    query: "sumSeries(summarize(production.kafka-lag.kafka-cluster-1.topics.*_production.consumer-group.*_precomputation.lag, '30min', 'max', false))&from=-60min&until=now"
Structure of config file
actionCooldown: time to wait after taking a scale up or scale down the action, this is useful when you want to wait for a while to see the effect of your action or wait for a while if that action completes in async fashion. for example when you are auto-scaling Kafka consumers you might want to wait because they can take some time to re-balance.
deployment: config block is used to configure deployment to target for auto-scaling.
- name: name of deployment to auto-scale
- namespace: namespace of target deployment
- minReplicas: minimum number of replicas to maintain, if the current number is below this, it directly scales up to this number
- maxReplicas: maximum number of replicas to go up to, if the current number is higher then this it directly scales down to this number
- fallbackReplicas: fallback replicas in case it fails to get the current metric value. When it fails to fetch metric from the metric server, it will gradually (1 step in each reconciliation step) scale up or scale down from current value to fallback replicas value. This config is there to avoid cascading failure/outage in target services due to the unavailability of metric servers. For example - let’s say, your current replica count is set to minReplicas because of low traffic, your metric server goes down and you get sudden burst of traffic. Hence, to avoid under-provisioning in those cases it fallbacks to this number, you can set this to the same as maxReplicas when you want to scale up to maximum capacity in the case when your metric server goes down.
metric: This config block contains configs that are used to decide an action based on metric value.
metricType: Indicates the nature of the metric and has two possible values, positive and negative.
- Positive metric type is used to indicate the metrics which are good when they are high. If the metric value is greater than the threshold, it's good and it should scale down i.e. perform Scale Down action. Server capacity (number of available threads in a server which can handle the incoming request) is a positive metric.
- Negative metric type is used to indicate metrics that are good when they are low. If the metric value is greater than the threshold, it's bad and it should scale up. i.e. perform Scale Up action. Lag in a message queue(eg. Kafka lag) is a negative metric.
metricThreshold(baseline threshold) and metricMargin(margin) are used to calculate the do-nothing range for a metric. When the current value of the metric falls in this range, it performs a Do Nothing action — which as you might have guessed — does nothing i.e no-op. Otherwise, it performs an appropriate action based on the metricType.
Do nothing range is from (metricThreshold - metricMargin) to (metricThreshold + metricMargin). for example, if metricThreshold = 10 and metricMargin = 5, then do-nothing range is from 5 to 15. If the metric value falls in this range, Autoscaler does nothing.
metricServer: This config block is used to fetch the metric value. The source is called the metric-server. Not to be confused with the Kubernetes metric server, the metric server here refers to the source where your metrics are stored (Graphite, InfluxDB, Prometheus, etc).
The metric-server is service which stores your metrics, and metric server adaptor is how PHPA talks to that service, It follows the adapter pattern. Currently, PHPA has support for Graphite and influxDB, but it’s fairly easy to add support for other metric servers. you can add support for new sources by writing an adaptor for them, see Graphite Adaptor for example.
metricServer config block will be different for each metric server adaptor, adaptor key is used to specify the adaptor to be used. data in the adaptor name key under metricServer config block will be passed to the adaptor. For reference see Graphite and InfluxDB configs.
Our usage
Kafka Consumers
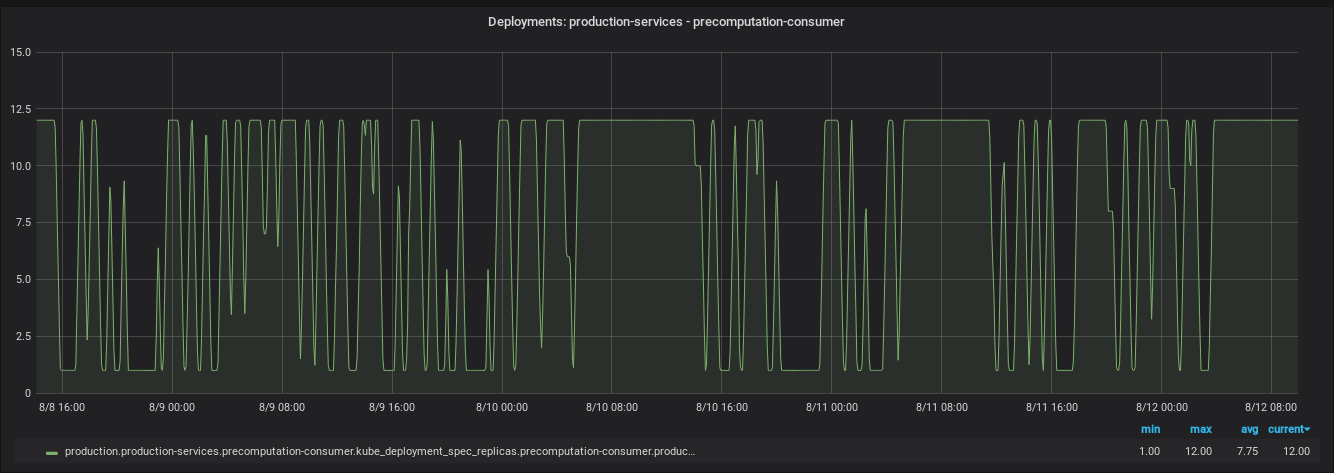
The primary usage for PHPA is to scale Kafka consumers based on the lag in topics they are consuming from. It was Kafka consumers for which the PHPA was created in the first place. As shown in the graph below, the consumers are scaled from 1 to 12 throughout the week. The metric that is used here to determine the actions to auto-scale is Kafka Lag from Graphite server.
Sidekiq
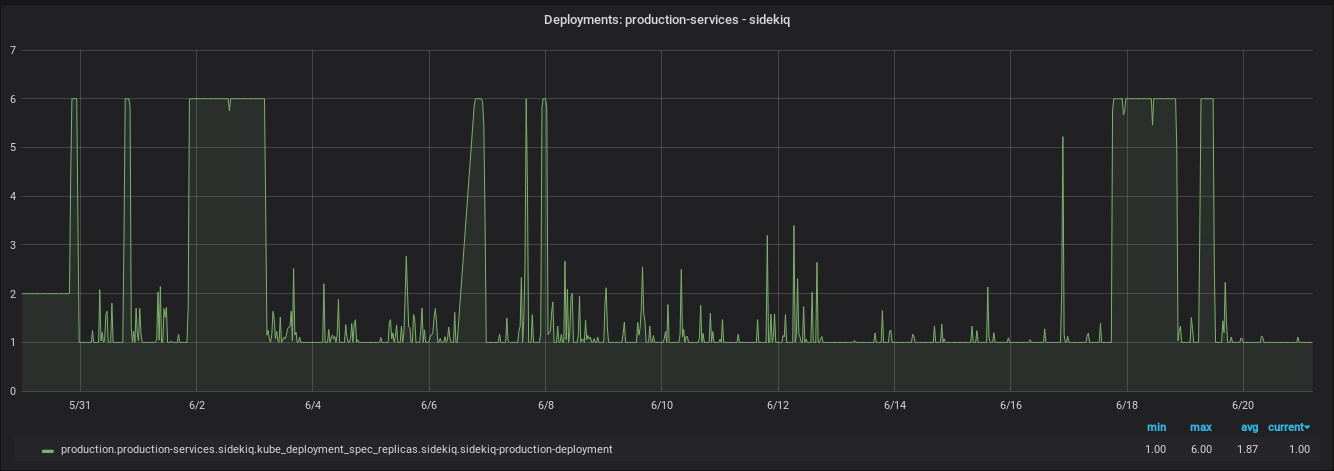
We use PHPA to scale our Sidekiq workers based on the number of jobs in the queue. There were instances that the jobs in Sidekiq would stay in the queue for a long time due to other long-running jobs occupying existing workers. Scaling Up in such cases would be helpful to schedule the jobs ASAP. As shown in the graph below, Sidekiq is scaled from 1 to 6 throughout the week. The metric used here to auto-scale is ‘Sidekiq wait time’ from Graphite server.
Learnings
Don’t deploy and go to a party
I deployed this to production for the first time on Friday and went to a party. Due to a config mishap, we racked up very high Kafka lag (~ 40 million), which was the biggest that we’d ever seen that resulted in an outage with customer impact.🙁

Add some sort of dry run feature
After Kafka lag mishap, we disabled it and added a dry run feature to test the config and threshold changes. So, if you happen to write an Autoscaler, make sure you add dry run feature before you cause an outage due to config mishaps or wrong thresholds.
Future Plans
Eventually, we would want to migrate PHPA to a Custom Kubernetes Controller and use Kubernetes CRD (CustomResourceDefinition) for PHPAConfig. Along with that having support for more metric server adaptors would be nice to have as well.
Closing Note
Clarisights believes that open source creates an environment of collaboration where high quality, better, more secure software is created and everybody wins. Hence, we have open-sourced PHPA and can be found on our GitHub — feel free to reach out, ask any questions, create issues and send us PRs with your improvements.
We also believe in giving our people the space to bring their creative ideas to life — and PHPA is just one fun and a useful example. If you enjoy working in a fun, high energy environment and want to solve really interesting and challenging engineering problems, check out our open positions. We’d love to hear from you.
Footnotes
* - Naming things is hard, relevant XKCD
This post is written by Suraj Nath.